Class Prediction Error
The Yellowbrick ClassPredictionError plot is a twist on other and sometimes more familiar classification model diagnostic tools like the Confusion Matrix and Classification Report. Like the Classification Report, this plot shows the support (number of training samples) for each class in the fitted classification model as a stacked bar chart. Each bar is segmented to show the proportion of predictions (including false negatives and false positives, like a Confusion Matrix) for each class. You can use a ClassPredictionError to visualize which classes your classifier is having a particularly difficult time with, and more importantly, what incorrect answers it is giving on a per-class basis. This can often enable you to better understand strengths and weaknesses of different models and particular challenges unique to your dataset.
The class prediction error chart provides a way to quickly understand how good your classifier is at predicting the right classes.
Visualizer |
|
Quick Method |
|
Models |
Classification |
Workflow |
Model evaluation |
from sklearn.datasets import make_classification
from sklearn.model_selection import train_test_split
from sklearn.ensemble import RandomForestClassifier
from yellowbrick.classifier import ClassPredictionError


# Create classification dataset
X, y = make_classification(
    n_samples=1000, n_classes=5, n_informative=3, n_clusters_per_class=1,
    random_state=36,
)

classes = ["apple", "kiwi", "pear", "banana", "orange"]

# Perform 80/20 training/test split
X_train, X_test, y_train, y_test = train_test_split(X, y, test_size=0.20,
                                                    random_state=42)
# Instantiate the classification model and visualizer
visualizer = ClassPredictionError(
    RandomForestClassifier(random_state=42, n_estimators=10), classes=classes
)

# Fit the training data to the visualizer
visualizer.fit(X_train, y_train)

# Evaluate the model on the test data
visualizer.score(X_test, y_test)

# Draw visualization
visualizer.show()
(Source code, png, pdf)
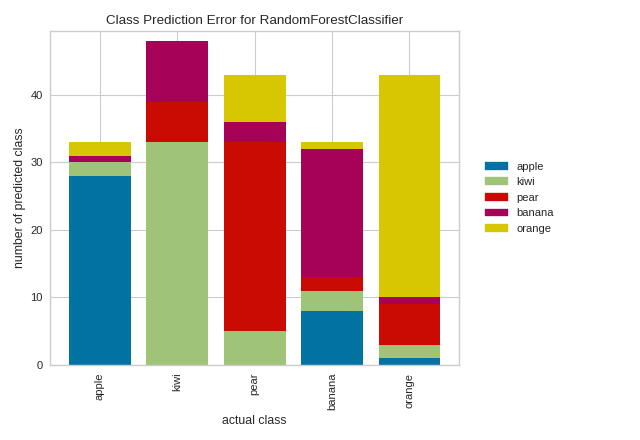
In the above example, while the RandomForestClassifier appears to be fairly good at correctly predicting apples based on the features of the fruit, it often incorrectly labels pears as kiwis and mistakes kiwis for bananas.
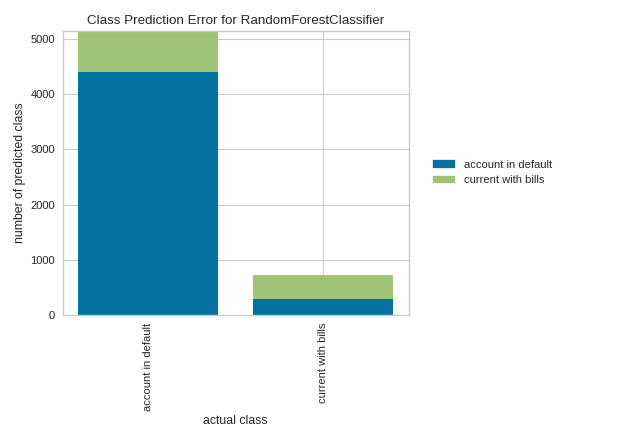
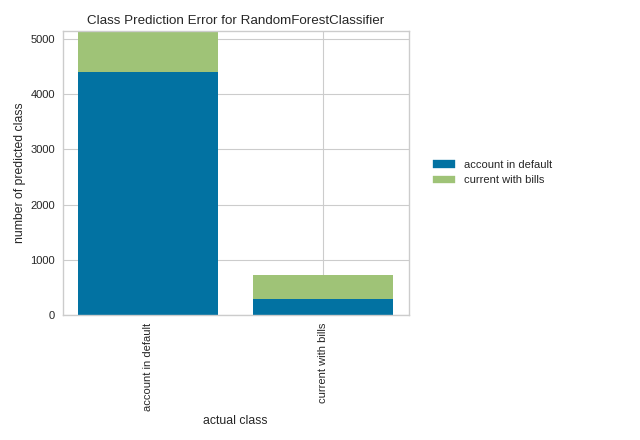
By contrast, in the following example, the RandomForestClassifier does a great job at correctly predicting accounts in default, but it is a bit of a coin toss in predicting account holders who stayed current on bills.
from sklearn.model_selection import train_test_split
from sklearn.ensemble import RandomForestClassifier
from yellowbrick.classifier import ClassPredictionError
from yellowbrick.datasets import load_credit

X, y = load_credit()

classes = ['account in default', 'current with bills']

# Perform 80/20 training/test split
X_train, X_test, y_train, y_test = train_test_split(X, y, test_size=0.20,
                                                    random_state=42)

# Instantiate the classification model and visualizer
visualizer = ClassPredictionError(
    RandomForestClassifier(n_estimators=10), classes=classes
)

# Fit the training data to the visualizer
visualizer.fit(X_train, y_train)

# Evaluate the model on the test data
visualizer.score(X_test, y_test)

# Draw visualization
visualizer.show()
(Source code, png, pdf)
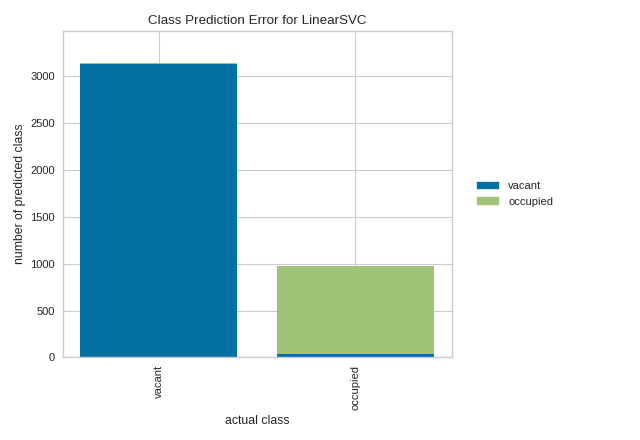
Quick Method
Similar functionality as above can be achieved in one line using the associated quick method, class_prediction_error. This method will instantiate and fit a ClassPredictionError visualizer on the training data, then will score it on the optionally provided test data (or the training data if it is not provided).
from sklearn.svm import LinearSVC
from sklearn.model_selection import train_test_split as tts
from yellowbrick.classifier import class_prediction_error
from yellowbrick.datasets import load_occupancy

# Load the dataset and split into train/test splits
X, y = load_occupancy()
X_train, X_test, y_train, y_test = tts(
    X, y, test_size=0.2, shuffle=True
)

class_prediction_error(
    LinearSVC(random_state=42),
    X_train, y_train, X_test, y_test,
    classes=["vacant", "occupied"]
)
(Source code, png, pdf)

API Reference
Shows the balance of classes and their associated predictions.
- class yellowbrick.classifier.class_prediction_error.ClassPredictionError(estimator, ax=None, classes=None, encoder=None, is_fitted='auto', force_model=False, **kwargs)[source]
Bases:
ClassificationScoreVisualizerClass Prediction Error chart that shows the support for each class in the fitted classification model displayed as a stacked bar. Each bar is segmented to show the distribution of predicted classes for each class. It is initialized with a fitted model and generates a class prediction error chart on draw.
- Parameters
- estimatorestimator
A scikit-learn estimator that should be a classifier. If the model is not a classifier, an exception is raised. If the internal model is not fitted, it is fit when the visualizer is fitted, unless otherwise specified by
is_fitted.- axmatplotlib Axes, default: None
The axes to plot the figure on. If not specified the current axes will be used (or generated if required).
- classeslist of str, defult: None
The class labels to use for the legend ordered by the index of the sorted classes discovered in the
fit()method. Specifying classes in this manner is used to change the class names to a more specific format or to label encoded integer classes. Some visualizers may also use this field to filter the visualization for specific classes. For more advanced usage specify an encoder rather than class labels.- encoderdict or LabelEncoder, default: None
A mapping of classes to human readable labels. Often there is a mismatch between desired class labels and those contained in the target variable passed to
fit()orscore(). The encoder disambiguates this mismatch ensuring that classes are labeled correctly in the visualization.- is_fittedbool or str, default=”auto”
Specify if the wrapped estimator is already fitted. If False, the estimator will be fit when the visualizer is fit, otherwise, the estimator will not be modified. If “auto” (default), a helper method will check if the estimator is fitted before fitting it again.
- force_modelbool, default: False
Do not check to ensure that the underlying estimator is a classifier. This will prevent an exception when the visualizer is initialized but may result in unexpected or unintended behavior.
- kwargsdict
Keyword arguments passed to the visualizer base classes.
- Attributes
- classes_ndarray of shape (n_classes,)
The class labels observed while fitting.
- class_count_ndarray of shape (n_classes,)
Number of samples encountered for each class during fitting.
- score_float
An evaluation metric of the classifier on test data produced when
score()is called. This metric is between 0 and 1 – higher scores are generally better. For classifiers, this score is usually accuracy, but ensure you check the underlying model for more details about the score.- predictions_ndarray
An ndarray of predictions whose rows are the true classes and whose columns are the predicted classes
- draw()[source]
Renders the class prediction error across the axis.
- Returns
- axMatplotlib Axes
The axes on which the figure is plotted
- finalize(**kwargs)[source]
Adds a title and axis labels to the visualizer, ensuring that the y limits zoom the visualization in to the area of interest. Finalize also calls tight layout to ensure that no parts of the figure are cut off.
Notes
Generally this method is called from show and not directly by the user.
- score(X, y)[source]
Generates a 2D array where each row is the count of the predicted classes and each column is the true class
- Parameters
- Xndarray or DataFrame of shape n x m
A matrix of n instances with m features
- yndarray or Series of length n
An array or series of target or class values
- Returns
- score_float
Global accuracy score
- yellowbrick.classifier.class_prediction_error.class_prediction_error(estimator, X_train, y_train, X_test=None, y_test=None, ax=None, classes=None, encoder=None, is_fitted='auto', force_model=False, show=True, **kwargs)[source]
Class Prediction Error
Divides the dataset X and y into train and test splits, fits the model on the train split, then scores the model on the test split. The visualizer displays the support for each class in the fitted classification model displayed as a stacked bar plot. Each bar is segmented to show the distribution of predicted classes for each class.
- Parameters
- estimatorestimator
A scikit-learn estimator that should be a classifier. If the model is not a classifier, an exception is raised. If the internal model is not fitted, it is fit when the visualizer is fitted, unless otherwise specified by
is_fitted.- X_trainndarray or DataFrame of shape n x m
A feature array of n instances with m features the model is trained on. Used to fit the visualizer and also to score the visualizer if test splits are not directly specified.
- y_trainndarray or Series of length n
An array or series of target or class values. Used to fit the visualizer and also to score the visualizer if test splits are not specified.
- X_testndarray or DataFrame of shape n x m, default: None
An optional feature array of n instances with m features that the model is scored on if specified, using X_train as the training data.
- y_testndarray or Series of length n, default: None
An optional array or series of target or class values that serve as actual labels for X_test for scoring purposes.
- axmatplotlib Axes, default: None
The axes to plot the figure on. If not specified the current axes will be used (or generated if required).
- classeslist of str, defult: None
The class labels to use for the legend ordered by the index of the sorted classes discovered in the
fit()method. Specifying classes in this manner is used to change the class names to a more specific format or to label encoded integer classes. Some visualizers may also use this field to filter the visualization for specific classes. For more advanced usage specify an encoder rather than class labels.- encoderdict or LabelEncoder, default: None
A mapping of classes to human readable labels. Often there is a mismatch between desired class labels and those contained in the target variable passed to
fit()orscore(). The encoder disambiguates this mismatch ensuring that classes are labeled correctly in the visualization.- is_fittedbool or str, default=”auto”
Specify if the wrapped estimator is already fitted. If False, the estimator will be fit when the visualizer is fit, otherwise, the estimator will not be modified. If “auto” (default), a helper method will check if the estimator is fitted before fitting it again.
- force_modelbool, default: False
Do not check to ensure that the underlying estimator is a classifier. This will prevent an exception when the visualizer is initialized but may result in unexpected or unintended behavior.
- show: bool, default: True
If True, calls
show(), which in turn callsplt.show()however you cannot callplt.savefigfrom this signature, norclear_figure. If False, simply callsfinalize()- kwargs: dict
Keyword arguments passed to the visualizer base classes.
- Returns
- vizClassPredictionError
Returns the fitted, finalized visualizer