Classification Report
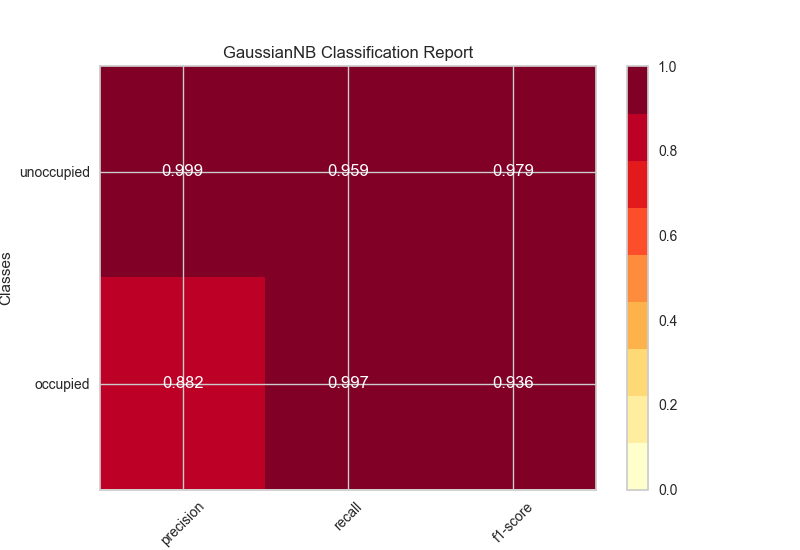
The classification report visualizer displays the precision, recall, and F1 scores for the model. In order to support easier interpretation and problem detection, the report integrates numerical scores with a color-coded heatmap.
# Load the classification data set
data = load_data('occupancy')

# Specify the features of interest and the classes of the target
features = ["temperature", "relative humidity", "light", "C02", "humidity"]
classes = ['unoccupied', 'occupied']

# Extract the numpy arrays from the data frame
X = data[features].as_matrix()
y = data.occupancy.as_matrix()

# Create the train and test data
X_train, X_test, y_train, y_test = train_test_split(X, y, test_size=0.2)
# Instantiate the classification model and visualizer
bayes = GaussianNB()
visualizer = ClassificationReport(bayes, classes=classes)

visualizer.fit(X_train, y_train)  # Fit the training data to the visualizer
visualizer.score(X_test, y_test)  # Evaluate the model on the test data
g = visualizer.poof()             # Draw/show/poof the data
API Reference
Visual classification report for classifier scoring.
-
class
yellowbrick.classifier.classification_report.ClassificationReport(model, ax=None, classes=None, **kwargs)[kaynak]¶ Bases:
yellowbrick.classifier.base.ClassificationScoreVisualizerClassification report that shows the precision, recall, and F1 scores for the model. Integrates numerical scores as well as a color-coded heatmap.
Parameters: - ax : The axis to plot the figure on.
- model : the Scikit-Learn estimator
Should be an instance of a classifier, else the __init__ will return an error.
- classes : a list of class names for the legend
If classes is None and a y value is passed to fit then the classes are selected from the target vector.
- colormap : optional string or matplotlib cmap to colorize lines
Use sequential heatmap.
- kwargs : keyword arguments passed to the super class.
Examples
>>> from yellowbrick.classifier import ClassificationReport
>>> from sklearn.linear_model import LogisticRegression
>>> viz = ClassificationReport(LogisticRegression())
>>> viz.fit(X_train, y_train)
>>> viz.score(X_test, y_test)
>>> viz.poof()
-
draw(y, y_pred)[kaynak]¶ Renders the classification report across each axis.
Parameters: - y : ndarray or Series of length n
An array or series of target or class values
- y_pred : ndarray or Series of length n
An array or series of predicted target values