RadViz Visualizer
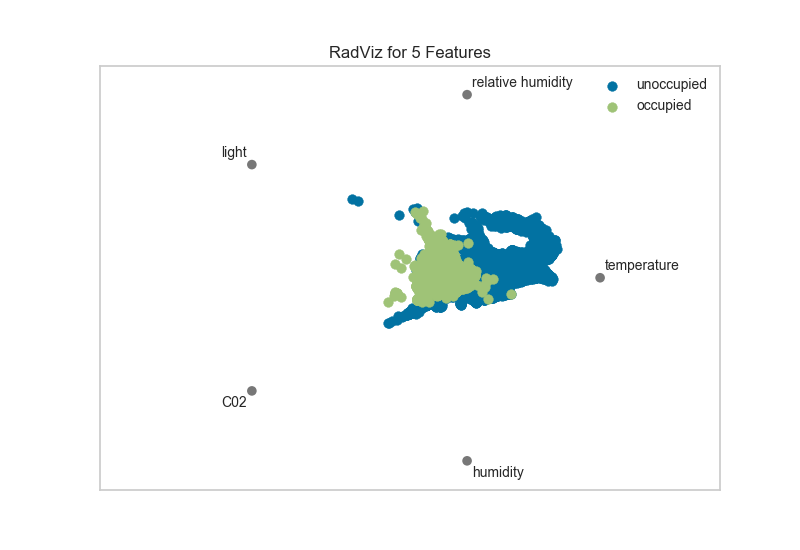
RadViz is a multivariate data visualization algorithm that plots each feature dimension uniformly around the circumference of a circle then plots points on the interior of the circle such that the point normalizes its values on the axes from the center to each arc. This mechanism allows as many dimensions as will easily fit on a circle, greatly expanding the dimensionality of the visualization.
Data scientists use this method to detect separability between classes. E.g. is there an opportunity to learn from the feature set or is there just too much noise?
If your data contains rows with missing values (numpy.nan), those missing values will not be plotted. In other words, you may not get the entire picture of your data. RadViz will raise a DataWarning to inform you of the percent missing.
If you do receive this warning, you may want to look at imputation strategies. A good starting place is scikit-learn Imputer.
# Load the classification data set
data = load_data('occupancy')

# Specify the features of interest and the classes of the target
features = ["temperature", "relative humidity", "light", "C02", "humidity"]
classes = ['unoccupied', 'occupied']

# Extract the numpy arrays from the data frame
X = data[features].as_matrix()
y = data.occupancy.as_matrix()
# Import the visualizer
from yellowbrick.features import RadViz

# Instantiate the visualizer
visualizer = RadViz(classes=classes, features=features)

visualizer.fit(X, y)      # Fit the data to the visualizer
visualizer.transform(X)   # Transform the data
visualizer.poof()         # Draw/show/poof the data
For regression, the RadViz visualizer should use a color sequence to display the target information, as opposed to discrete colors.
API Reference
Implements radviz for feature analysis.
-
class
yellowbrick.features.radviz.RadialVisualizer(ax=None, features=None, classes=None, color=None, colormap=None, **kwargs)[kaynak]¶ Bases:
yellowbrick.features.base.DataVisualizerRadViz is a multivariate data visualization algorithm that plots each axis uniformely around the circumference of a circle then plots points on the interior of the circle such that the point normalizes its values on the axes from the center to each arc.
Parameters: - ax : matplotlib Axes, default: None
The axis to plot the figure on. If None is passed in the current axes will be used (or generated if required).
- features : list, default: None
a list of feature names to use If a DataFrame is passed to fit and features is None, feature names are selected as the columns of the DataFrame.
- classes : list, default: None
a list of class names for the legend If classes is None and a y value is passed to fit then the classes are selected from the target vector.
- color : list or tuple, default: None
optional list or tuple of colors to colorize lines Use either color to colorize the lines on a per class basis or colormap to color them on a continuous scale.
- colormap : string or cmap, default: None
optional string or matplotlib cmap to colorize lines Use either color to colorize the lines on a per class basis or colormap to color them on a continuous scale.
- kwargs : dict
Keyword arguments that are passed to the base class and may influence the visualization as defined in other Visualizers.
Notes
These parameters can be influenced later on in the visualization process, but can and should be set as early as possible.
Examples
>>> visualizer = RadViz()
>>> visualizer.fit(X, y)
>>> visualizer.transform(X)
>>> visualizer.poof()
-
draw(X, y, **kwargs)[kaynak]¶ Called from the fit method, this method creates the radviz canvas and draws each instance as a class or target colored point, whose location is determined by the feature data set.
-
yellowbrick.features.radviz.RadViz¶ şunun takma adı:
yellowbrick.features.radviz.RadialVisualizer