Feature Dropping Curve
Visualizer
Quick Method
Models
Classification, Regression, Clustering
Workflow
Model Selection
A feature dropping curve (FDC) shows the relationship between the score and the number of features used. This visualizer randomly drops input features, showing how the estimator benefits from additional features of the same type. For example, how many air quality sensors are needed across a city to accurately predict city-wide pollution levels?
Feature dropping curves helpfully complement Recursive Feature Elimination (RFECV). In the air quality sensor example, RFECV finds which sensors to keep in the specific city. Feature dropping curves estimate how many sensors a similar-sized city might need to track pollution levels.
Feature dropping curves are common in the field of neural decoding, where they are called neuron dropping curves (example, panels C and H). Neural decoding research often quantifies how performance scales with neuron (or electrode) count. Because neurons do not correspond directly between participants, we use random neuron subsets to simulate what performance to expect when recording from other participants.
To show how this works in practice, consider an image classification example using handwritten digits.
from sklearn.svm import SVC
from sklearn.datasets import load_digits

from yellowbrick.model_selection import DroppingCurve

# Load dataset
X, y = load_digits(return_X_y=True)

# Initialize visualizer with estimator
visualizer = DroppingCurve(SVC())

# Fit the data to the visualizer
visualizer.fit(X, y)
# Finalize and render the figure
visualizer.show()
(Source code, png, pdf)
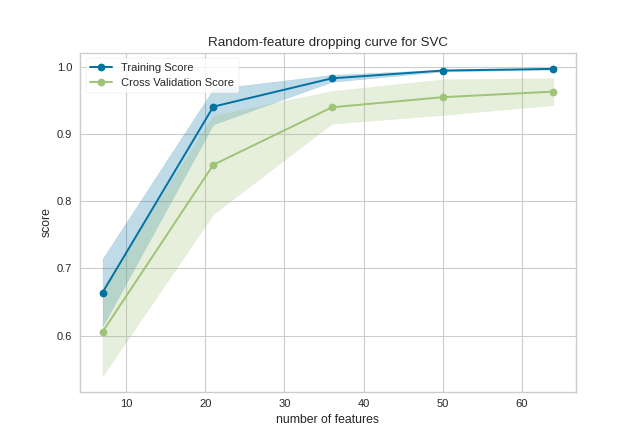
This figure shows an input feature dropping curve. Since the features are informative, the accuracy increases with more larger feature subsets. The shaded area represents the variability of cross-validation, one standard deviation above and below the mean accuracy score drawn by the curve.
The visualization can be interpreted as the performance if we knew some image pixels were corrupted. As an alternative interpretation, the dropping curve roughly estimates the accuracy if the image resolution was downsampled.
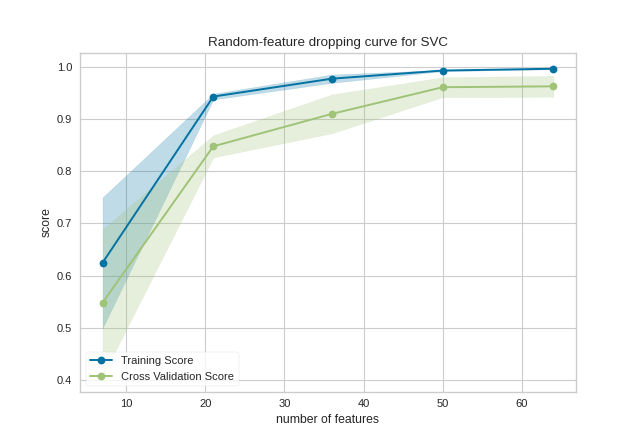
Quick Method
The same functionality can be achieved with the associated quick method dropping_curve. This method will build the DroppingCurve with the associated arguments, fit it, then (optionally) immediately show the visualization.
from sklearn.svm import SVC
from sklearn.datasets import load_digits

from yellowbrick.model_selection import dropping_curve

# Load dataset
X, y = load_digits(return_X_y=True)

dropping_curve(SVC(), X, y)
(Source code, png, pdf)

API Reference
Implements a random-input-dropout curve visualization for model selection. Another common name: neuron dropping curve (NDC), in neural decoding research
- class yellowbrick.model_selection.dropping_curve.DroppingCurve(estimator, ax=None, feature_sizes=array([0.1, 0.325, 0.55, 0.775, 1.0]), groups=None, logx=False, cv=None, scoring=None, n_jobs=None, pre_dispatch='all', random_state=None, **kwargs)[source]
Bases:
ModelVisualizerSelects random subsets of features and estimates the training and crossvalidation performance. Subset sizes are swept to visualize a feature-dropping curve.
The visualization plots the score relative to each subset and shows the number of (randomly selected) features needed to achieve a score. The curve is often shaped like log(1+x). For example, see: https://www.frontiersin.org/articles/10.3389/fnsys.2014.00102/full
- Parameters
- estimatora scikit-learn estimator
An object that implements
fitandpredict, can be a classifier, regressor, or clusterer so long as there is also a valid associated scoring metric.Note that the object is cloned for each validation.
- feature_sizes: array-like, shape (n_values,)
default:
np.linspace(0.1,1.0,5)Relative or absolute numbers of input features that will be used to generate the learning curve. If the dtype is float, it is regarded as a fraction of the maximum number of features, otherwise it is interpreted as absolute numbers of features.
- groupsarray-like, with shape (n_samples,)
Optional group labels for the samples used while splitting the dataset into train/test sets.
- axmatplotlib.Axes object, optional
The axes object to plot the figure on.
- logxboolean, optional
If True, plots the x-axis with a logarithmic scale.
- cvint, cross-validation generator or an iterable, optional
Determines the cross-validation splitting strategy. Possible inputs for cv are:
None, to use the default 3-fold cross-validation,
integer, to specify the number of folds.
An object to be used as a cross-validation generator.
An iterable yielding train/test splits.
see the scikit-learn cross-validation guide for more information on the possible strategies that can be used here.
- scoringstring, callable or None, optional, default: None
A string or scorer callable object / function with signature
scorer(estimator, X, y). See scikit-learn model evaluation documentation for names of possible metrics.- n_jobsinteger, optional
Number of jobs to run in parallel (default 1).
- pre_dispatchinteger or string, optional
Number of predispatched jobs for parallel execution (default is all). The option can reduce the allocated memory. The string can be an expression like ‘2*n_jobs’.
- random_stateint, RandomState instance or None, optional (default=None)
If int, random_state is the seed used by the random number generator; If RandomState instance, random_state is the random number generator; If None, the random number generator is the RandomState instance used by np.random. Used to generate feature subsets.
- kwargsdict
Keyword arguments that are passed to the base class and may influence the visualization as defined in other Visualizers.
Notes
This visualizer is based on sklearn.model_selection.validation_curve
Examples
>>> from yellowbrick.model_selection import DroppingCurve
>>> from sklearn.naive_bayes import GaussianNB
>>> model = DroppingCurve(GaussianNB())
>>> model.fit(X, y)
>>> model.show()
- Attributes
- feature_sizes_array, shape = (n_unique_ticks,), dtype int
Numbers of features that have been used to generate the dropping curve. Note that the number of ticks might be less than n_ticks because duplicate entries will be removed.
- train_scores_array, shape (n_ticks, n_cv_folds)
Scores on training sets.
- train_scores_mean_array, shape (n_ticks,)
Mean training data scores for each training split
- train_scores_std_array, shape (n_ticks,)
Standard deviation of training data scores for each training split
- valid_scores_array, shape (n_ticks, n_cv_folds)
Scores on validation set.
- valid_scores_mean_array, shape (n_ticks,)
Mean scores for each validation split
- valid_scores_std_array, shape (n_ticks,)
Standard deviation of scores for each validation split
- fit(X, y=None)[source]
Fits the feature dropping curve with the wrapped model to the specified data. Draws training and cross-validation score curves and saves the scores to the estimator.
- Parameters
- Xarray-like, shape (n_samples, n_features)
Input vector, where n_samples is the number of samples and n_features is the number of features.
- yarray-like, shape (n_samples) or (n_samples, n_features), optional
Target relative to X for classification or regression; None for unsupervised learning.
- yellowbrick.model_selection.dropping_curve.dropping_curve(estimator, X, y, feature_sizes=array([0.1, 0.325, 0.55, 0.775, 1.0]), groups=None, ax=None, logx=False, cv=None, scoring=None, n_jobs=None, pre_dispatch='all', random_state=None, show=True, **kwargs) DroppingCurve[source]
Displays a random-feature dropping curve, comparing feature size to training and cross validation scores. The dropping curve aims to show how a model improves with more information.
This helper function wraps the DroppingCurve class for one-off analysis.
- Parameters
- estimatora scikit-learn estimator
An object that implements
fitandpredict, can be a classifier, regressor, or clusterer so long as there is also a valid associated scoring metric.Note that the object is cloned for each validation.
- Xarray-like, shape (n_samples, n_features)
Input vector, where n_samples is the number of samples and n_features is the number of features.
- yarray-like, shape (n_samples) or (n_samples, n_features), optional
Target relative to X for classification or regression; None for unsupervised learning.
- feature_sizes: array-like, shape (n_values,)
default:
np.linspace(0.1,1.0,5)Relative or absolute numbers of input features that will be used to generate the learning curve. If the dtype is float, it is regarded as a fraction of the maximum number of features, otherwise it is interpreted as absolute numbers of features.
- groupsarray-like, with shape (n_samples,)
Optional group labels for the samples used while splitting the dataset into train/test sets.
- axmatplotlib.Axes object, optional
The axes object to plot the figure on.
- logxboolean, optional
If True, plots the x-axis with a logarithmic scale.
- cvint, cross-validation generator or an iterable, optional
Determines the cross-validation splitting strategy. Possible inputs for cv are:
None, to use the default 3-fold cross-validation,
integer, to specify the number of folds.
An object to be used as a cross-validation generator.
An iterable yielding train/test splits.
see the scikit-learn cross-validation guide for more information on the possible strategies that can be used here.
- scoringstring, callable or None, optional, default: None
A string or scorer callable object / function with signature
scorer(estimator, X, y). See scikit-learn model evaluation documentation for names of possible metrics.- n_jobsinteger, optional
Number of jobs to run in parallel (default 1).
- pre_dispatchinteger or string, optional
Number of predispatched jobs for parallel execution (default is all). The option can reduce the allocated memory. The string can be an expression like ‘2*n_jobs’.
- random_stateint, RandomState instance or None, optional (default=None)
If int, random_state is the seed used by the random number generator; If RandomState instance, random_state is the random number generator; If None, the random number generator is the RandomState instance used by np.random. Used to generate feature subsets.
- kwargsdict
Keyword arguments that are passed to the base class and may influence the visualization as defined in other Visualizers.
- Returns
- dcDroppingCurve
Returns the fitted visualizer.