Dispersion Plot
A word’s importance can be weighed by its dispersion in a corpus. Lexical dispersion is a measure of a word’s homogeneity across the parts of a corpus.
Lexical dispersion illustrates the homogeneity of a word (or set of words) across
the documents of a corpus. DispersionPlot allows for visualization of the lexical dispersion of words in a corpus. This plot illustrates with vertical lines the occurrences of one or more search terms throughout the corpus, noting how many words relative to the beginning of the corpus it appears.
Visualizer |
|
Quick Method |
|
Models |
Text Modeling |
Workflow |
Feature Engineering |
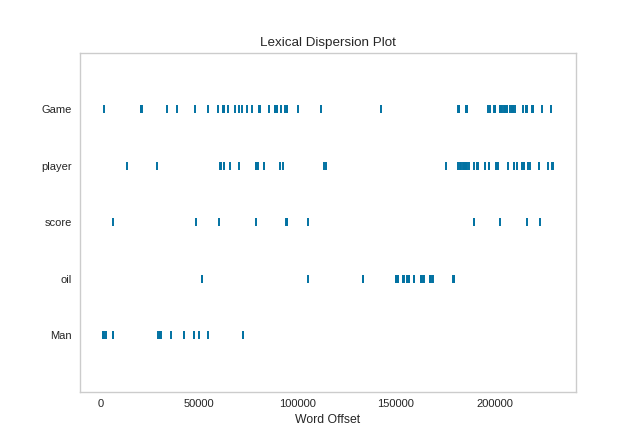
from yellowbrick.text import DispersionPlot
from yellowbrick.datasets import load_hobbies

# Load the text data
corpus = load_hobbies()

# Create a list of words from the corpus text
text = [doc.split() for doc in corpus.data]

# Choose words whose occurence in the text will be plotted
target_words = ['Game', 'player', 'score', 'oil', 'Man']

# Create the visualizer and draw the plot
visualizer = DispersionPlot(target_words)
visualizer.fit(text)
visualizer.show()
(Source code, png, pdf)

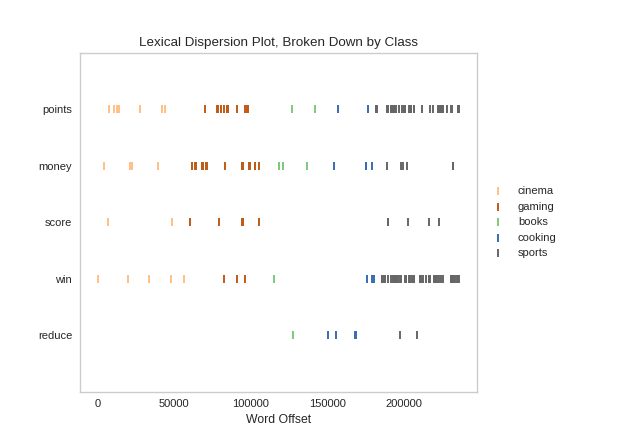
If the target vector of the corpus documents is provided, the points will be colored with respect to their document category, which allows for additional analysis of relationships in search term homogeneity within and across document categories.
from yellowbrick.text import DispersionPlot
from yellowbrick.datasets import load_hobbies

corpus = load_hobbies()
text = [doc.split() for doc in corpus.data]
y = corpus.target

target_words = ['points', 'money', 'score', 'win', 'reduce']

visualizer = DispersionPlot(
    target_words,
    colormap="Accent",
    title="Lexical Dispersion Plot, Broken Down by Class"
)
visualizer.fit(text, y)
visualizer.show()
(Source code, png, pdf)

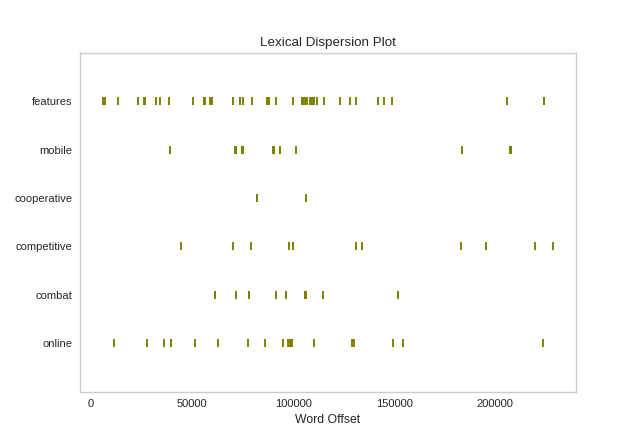
Quick Method
The same functionality above can be achieved with the associated quick method dispersion. This method will build the Dispersion Plot object with the associated arguments, fit it, then (optionally) immediately show the visualization.
from yellowbrick.text import DispersionPlot, dispersion
from yellowbrick.datasets import load_hobbies

# Load the text data
corpus = load_hobbies()

# Create a list of words from the corpus text
text = [doc.split() for doc in corpus.data]

# Choose words whose occurence in the text will be plotted
target_words = ['features', 'mobile', 'cooperative', 'competitive', 'combat', 'online']

# Create the visualizer and draw the plot
dispersion(target_words, text, colors=['olive'])
(Source code, png, pdf)
API Reference
Implementation of lexical dispersion for text visualization
- class yellowbrick.text.dispersion.DispersionPlot(search_terms, ax=None, colors=None, colormap=None, ignore_case=False, annotate_docs=False, labels=None, **kwargs)[source]
Bases:
TextVisualizerLexical dispersion illustrates the homogeneity of a word (or set of words) across the documents of a corpus.
DispersionPlot allows for visualization of the lexical dispersion of words in a corpus. This plot illustrates with vertical lines the occurrences of one or more search terms throughout the corpus, noting how many words relative to the beginning of the corpus it appears. If the target vector of the corpus documents is provided, the points will be colored with respect to their document category, which allows for additional analysis of relationships in search term homogeneity within and across document categories. If annotation is requested, document boundaries will be displayed as vertical lines in the plot.
- Parameters
- search_termslist
A list of search terms whose dispersion across a corpus passed at fit should be visualized.
- axmatplotlib axes, default: None
The axes to plot the figure on.
- colorslist or tuple of colors
Specify the colors for each individual class. Will override colormap if both are provided.
- colormapstring or matplotlib cmap
Qualitative colormap for discrete target
- ignore_caseboolean, default: False
Specify whether input will be case-sensitive.
- annotate_docsboolean, default: False
Specify whether document boundaries will be displayed. Vertical lines are positioned at the end of each document.
- labelslist of strings
The names of the classes in the target, used to create a legend. Labels must match names of classes in sorted order.
- kwargsdict
Pass any additional keyword arguments to the super class.
- Attributes
- self.classes_list
A list of strings representing the unique classes in the target in sorted order. If
yis provided, these are extracted fromy, unless a list of class labels is provided by the user on instantiation.- self.boundaries_list
A list of integers indicating the document boundaries with respect to word offsets.
- self.indexed_words_list
A list of integers indicating the y position for each occurrence of each of the search terms.
- self.word_categories_list
A list of strings indicating the corresponding document category of each search term occurrence.
- NULL_CLASS = None
- draw(points, **kwargs)[source]
Called from the fit method, this method creates the canvas and draws the plot on it.
- Parameters
- kwargs: generic keyword arguments.
- finalize(**kwargs)[source]
Prepares the figure for rendering by adding a title, axis labels, and managing the limits of the text labels. Adds a legend outside of the plot.
- Parameters
- kwargs: generic keyword arguments.
Notes
Generally this method is called from show and not directly by the user.
- fit(X, y=None, **kwargs)[source]
The fit method is the primary drawing input for the dispersion visualization.
- Parameters
- Xlist or generator
Should be provided as a list of documents or a generator that yields a list of documents that contain a list of words in the order they appear in the document.
- yndarray or Series of length n
An optional array or series of target or class values for instances. If this is specified, then the points will be colored according to their class.
- Returns
- selfinstance
Returns the instance of the transformer/visualizer
- Attributes
- self.classes_list
A list of strings representing the unique classes in the target in sorted order. If
yis provided, these are extracted fromy, unless a list of class labels is provided by the user on instantiation.- self.indexed_words_list
A list of integers indicating the y position for each occurrence of each of the search terms.
- self.word_categories_list
A list of strings indicating the corresponding document category of each search term occurrence.
- yellowbrick.text.dispersion.dispersion(search_terms, corpus, y=None, ax=None, colors=None, colormap=None, annotate_docs=False, ignore_case=False, labels=None, show=True, **kwargs)[source]
Displays lexical dispersion plot for words in a corpus
This helper function is a quick wrapper to utilize the DispersionPlot Visualizer for one-off analysis
- Parameters
- search_termslist
A list of words whose dispersion will be examined within a corpus
- corpuslist
Should be provided as a list of documents that contain a list of words in the order they appear in the document.
- yndarray or Series of length n
An optional array or series of target or class values for instances. If this is specified, then the points will be colored according to their class.
- axmatplotlib axes, default: None
The axes to plot the figure on.
- colorslist or tuple of colors
Specify the colors for each individual class. Will override colormap if both are provided.
- colormapstring or matplotlib cmap
Qualitative colormap for discrete target
- annotate_docsboolean, default: False
Specify whether document boundaries will be displayed. Vertical lines are positioned at the end of each document.
- ignore_caseboolean, default: False
Specify whether input will be case-sensitive.
- labelslist of strings
The names of the classes in the target, used to create a legend. Labels must match names of classes in sorted order.
- showbool, default: True
If True, calls
show(), which in turn callsplt.show()however you cannot callplt.savefigfrom this signature, norclear_figure. If False, simply callsfinalize()- kwargsdict
Pass any additional keyword arguments to the super class.
- Returns
- viz: DispersionPlot
Returns the fitted, finalized visualizer