Scatter Plot Visualizer
Sometimes for feature analysis you simply need a scatter plot to determine the distribution of data. Machine learning operates on high dimensional data, so the number of dimensions has to be filtered. As a result these visualizations are typically used as the base for larger visualizers; however you can also use them to quickly plot data during ML analysis.
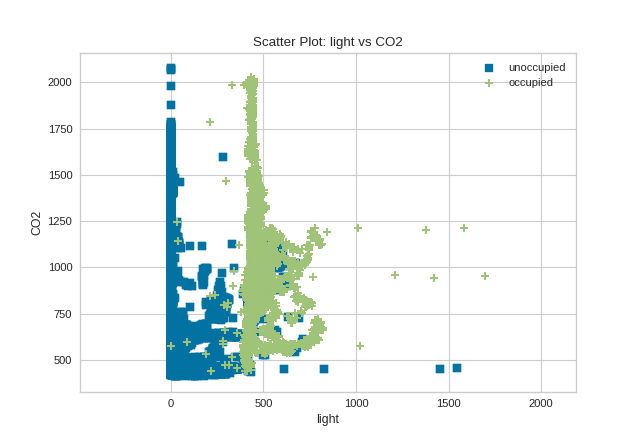
A scatter visualizer simply plots two features against each other and colors the points according to the target. This can be useful in assessing the relationship of pairs of features to an individual target.
from yellowbrick.contrib.scatter import ScatterVisualizer
from yellowbrick.datasets import load_occupancy

# Load the classification dataset
X, y = load_occupancy()

# Specify the target classes
classes = ["unoccupied", "occupied"]

# Instantiate the visualizer
visualizer = ScatterVisualizer(x="light", y="CO2", classes=classes)

visualizer.fit(X, y)           # Fit the data to the visualizer
visualizer.transform(X)        # Transform the data
visualizer.show()              # Finalize and render the figure
(Source code, png, pdf)
API Reference
Implements a 2D scatter plot for feature analysis.
- class yellowbrick.contrib.scatter.ScatterVisualizer(ax=None, x=None, y=None, features=None, classes=None, color=None, colormap=None, markers=None, alpha=1.0, **kwargs)[source]
Bases:
DataVisualizerScatterVisualizer is a bivariate feature data visualization algorithm that plots using the Cartesian coordinates of each point.
- Parameters
- axa matplotlib plot, default: None
The axis to plot the figure on.
- xstring, default: None
The feature name that corresponds to a column name or index postion in the matrix that will be plotted against the x-axis
- ystring, default: None
The feature name that corresponds to a column name or index postion in the matrix that will be plotted against the y-axis
- featuresa list of two feature names to use, default: None
List of two features that correspond to the columns in the array. The order of the two features correspond to X and Y axes on the graph. More than two feature names or columns will raise an error. If a DataFrame is passed to fit and features is None, feature names are selected that are the columns of the DataFrame.
- classesa list of class names for the legend, default: None
If classes is None and a y value is passed to fit then the classes are selected from the target vector.
- coloroptional list or tuple of colors to colorize points, default: None
Use either color to colorize the points on a per class basis or colormap to color them on a continuous scale.
- colormapoptional string or matplotlib cmap to colorize points, default: None
Use either color to colorize the points on a per class basis or colormap to color them on a continuous scale.
- markersiterable of strings, default: ,+o*vhd
Matplotlib style markers for points on the scatter plot points
- alphafloat, default: 1.0
Specify a transparency where 1 is completely opaque and 0 is completely transparent. This property makes densely clustered points more visible.
- kwargskeyword arguments passed to the super class.
- These parameters can be influenced later on in the visualization
- process, but can and should be set as early as possible.
- draw(X, y, **kwargs)[source]
Called from the fit method, this method creates a scatter plot that draws each instance as a class or target colored point, whose location is determined by the feature data set.
- finalize(**kwargs)[source]
Adds a title and a legend and ensures that the axis labels are set as the feature names being visualized.
- Parameters
- kwargs: generic keyword arguments.
Notes
Generally this method is called from show and not directly by the user.
- fit(X, y=None, **kwargs)[source]
The fit method is the primary drawing input for the parallel coords visualization since it has both the X and y data required for the viz and the transform method does not.
- Parameters
- Xndarray or DataFrame of shape n x m
A matrix of n instances with 2 features
- yndarray or Series of length n
An array or series of target or class values
- kwargsdict
Pass generic arguments to the drawing method
- Returns
- selfinstance
Returns the instance of the transformer/visualizer