Elbow Method
The elbow method for \(K\) selection visualizes multiple clustering models with different values for \(K\). Model selection is based on whether or not there is an "elbow" in the curve; e.g. if the curve looks like an arm, if there is a clear change in angle from one part of the curve to another.
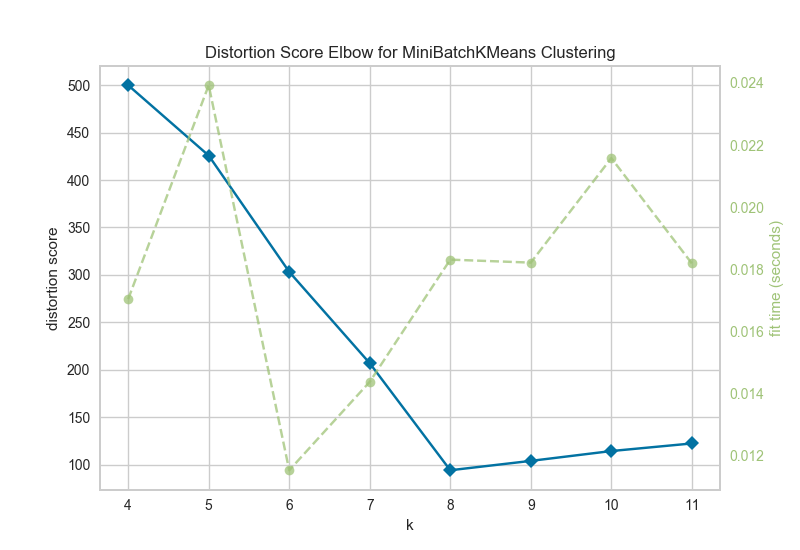
# Make 8 blobs dataset
X, y = make_blobs(centers=8)
# Instantiate the clustering model and visualizer
visualizer = KElbowVisualizer(MiniBatchKMeans(), k=(4,12))

visualizer.fit(X) # Fit the training data to the visualizer
visualizer.poof() # Draw/show/poof the data
API Reference
Implements the elbow method for determining the optimal number of clusters. https://bl.ocks.org/rpgove/0060ff3b656618e9136b
-
class
yellowbrick.cluster.elbow.KElbowVisualizer(model, ax=None, k=10, metric='distortion', timings=True, **kwargs)[源代码]¶ 基类:
yellowbrick.cluster.base.ClusteringScoreVisualizerThe K-Elbow Visualizer implements the "elbow" method of selecting the optimal number of clusters for K-means clustering. K-means is a simple unsupervised machine learning algorithm that groups data into a specified number (k) of clusters. Because the user must specify in advance what k to choose, the algorithm is somewhat naive -- it assigns all members to k clusters even if that is not the right k for the dataset.
The elbow method runs k-means clustering on the dataset for a range of values for k (say from 1-10) and then for each value of k computes an average score for all clusters. By default, the
distortion_scoreis computed, the sum of square distances from each point to its assigned center. Other metrics can also be used such as thesilhouette_score, the mean silhouette coefficient for all samples or thecalinski_harabaz_score, which computes the ratio of dispersion between and within clusters.When these overall metrics for each model are plotted, it is possible to visually determine the best value for K. If the line chart looks like an arm, then the "elbow" (the point of inflection on the curve) is the best value of k. The "arm" can be either up or down, but if there is a strong inflection point, it is a good indication that the underlying model fits best at that point.
Parameters: - model : a Scikit-Learn clusterer
Should be an instance of a clusterer, specifically
KMeansorMiniBatchKMeans. If it is not a clusterer, an exception is raised.- ax : matplotlib Axes, default: None
The axes to plot the figure on. If None is passed in the current axes will be used (or generated if required).
- k : integer or tuple
The range of k to compute silhouette scores for. If a single integer is specified, then will compute the range (2,k) otherwise the specified range in the tuple is used.
- metric : string, default:
"distortion" Select the scoring metric to evaluate the clusters. The default is the mean distortion, defined by the sum of squared distances between each observation and its closest centroid. Other metrics include:
- distortion: mean sum of squared distances to centers
- silhouette: mean ratio of intra-cluster and nearest-cluster distance
- calinski_harabaz: ratio of within to between cluster dispersion
- timings : bool, default: True
Display the fitting time per k to evaluate the amount of time required to train the clustering model.
- kwargs : dict
Keyword arguments that are passed to the base class and may influence the visualization as defined in other Visualizers.
Notes
If you get a visualizer that doesn't have an elbow or inflection point, then this method may not be working. The elbow method does not work well if the data is not very clustered; in this case you might see a smooth curve and the value of k is unclear. Other scoring methods such as BIC or SSE also can be used to explore if clustering is a correct choice.
For a discussion on the Elbow method, read more at Robert Gove's Block.
Examples
>>> from yellowbrick.cluster import KElbowVisualizer
>>> from sklearn.cluster import KMeans
>>> model = KElbowVisualizer(KMeans(), k=10)
>>> model.fit(X)
>>> model.poof()