Balanced Binning Reference
Frequently, machine learning problems in the real world suffer from the curse of dimensionality; you have fewer training instances than you’d like and the predictive signal is distributed (often unpredictably!) across many different features.
Sometimes when the your target variable is continuously-valued, there simply aren’t enough instances to predict these values to the precision of regression. In this case, we can sometimes transform the regression problem into a classification problem by binning the continuous values into makeshift classes.
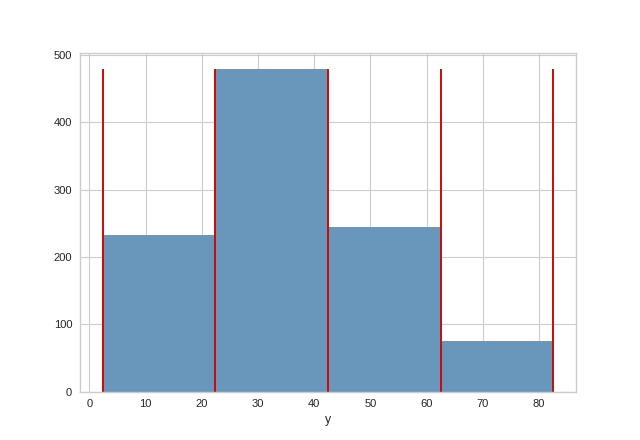
To help the user select the optimal number of bins, the BalancedBinningReference visualizer takes the target variable y as input and generates a histogram with vertical lines indicating the recommended value points to ensure that the data is evenly distributed into each bin.
Visualizer |
|
Quick Method |
|
Models |
Classification |
Workflow |
Feature analysis, Target analysis, Model selection |
from yellowbrick.datasets import load_concrete
from yellowbrick.target import BalancedBinningReference

# Load the concrete dataset
X, y = load_concrete()

# Instantiate the visualizer
visualizer = BalancedBinningReference()

visualizer.fit(y)        # Fit the data to the visualizer
visualizer.show()        # Finalize and render the figure
(Source code, png, pdf)

Quick Method
The same functionality above can be achieved with the associated quick method balanced_binning_reference. This method will build the BalancedBinningReference object with the associated arguments, fit it, then (optionally) immediately show it.
from yellowbrick.datasets import load_concrete
from yellowbrick.target import balanced_binning_reference

# Load the dataset
X, y = load_concrete()

# Use the quick method and immediately show the figure
balanced_binning_reference(y)
(Source code, png, pdf)
See also
To learn more, please read Rebecca Bilbro’s article “Creating Categorical Variables from Continuous Data.”
API Reference
Implements histogram with vertical lines to help with balanced binning.
- class yellowbrick.target.binning.BalancedBinningReference(ax=None, target=None, bins=4, **kwargs)[source]
Bases:
TargetVisualizerBalancedBinningReference generates a histogram with vertical lines showing the recommended value point to bin your data so they can be evenly distributed in each bin.
- Parameters
- axmatplotlib Axes, default: None
This is inherited from FeatureVisualizer and is defined within
BalancedBinningReference.- targetstring, default: “y”
The name of the
yvariable- binsnumber of bins to generate the histogram, default: 4
- kwargsdict
Keyword arguments that are passed to the base class and may influence the visualization as defined in other Visualizers.
Notes
These parameters can be influenced later on in the visualization process, but can and should be set as early as possible.
Examples
>>> visualizer = BalancedBinningReference()
>>> visualizer.fit(y)
>>> visualizer.show()
- Attributes
- bin_edges_binning reference values
- draw(y, **kwargs)[source]
Draws a histogram with the reference value for binning as vertical lines.
- Parameters
- yan array of one dimension or a pandas Series
- yellowbrick.target.binning.balanced_binning_reference(y, ax=None, target='y', bins=4, show=True, **kwargs)[source]
BalancedBinningReference generates a histogram with vertical lines showing the recommended value point to bin your data so they can be evenly distributed in each bin.
- Parameters
- yan array of one dimension or a pandas Series
- axmatplotlib Axes, default: None
This is inherited from FeatureVisualizer and is defined within
BalancedBinningReference.- targetstring, default: “y”
The name of the
yvariable- binsnumber of bins to generate the histogram, default: 4
- showbool, default: True
If True, calls
show(), which in turn callsplt.show(). However, you cannot callplt.savefigfrom this signature, norclear_figure. If False, simply callsfinalize().- kwargsdict
Keyword arguments that are passed to the base class and may influence the visualization as defined in other Visualizers.
- Returns
- visualizerBalancedBinningReference
Returns fitted visualizer