Intercluster Distance Maps
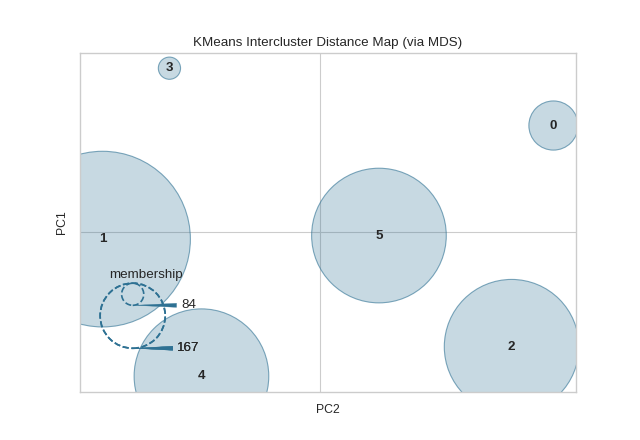
Intercluster distance maps display an embedding of the cluster centers in 2 dimensions with the distance to other centers preserved. E.g. the closer to centers are in the visualization, the closer they are in the original feature space. The clusters are sized according to a scoring metric. By default, they are sized by membership, e.g. the number of instances that belong to each center. This gives a sense of the relative importance of clusters. Note however, that because two clusters overlap in the 2D space, it does not imply that they overlap in the original feature space.
Visualizer |
|
Quick Method |
|
Models |
Clustering |
Workflow |
Model evaluation |
from sklearn.cluster import KMeans
from sklearn.datasets import make_blobs

from yellowbrick.cluster import InterclusterDistance

# Generate synthetic dataset with 12 random clusters
X, y = make_blobs(n_samples=1000, n_features=12, centers=12, random_state=42)

# Instantiate the clustering model and visualizer
model = KMeans(6)
visualizer = InterclusterDistance(model)

visualizer.fit(X)        # Fit the data to the visualizer
visualizer.show()        # Finalize and render the figure
(Source code, png, pdf)

Quick Method
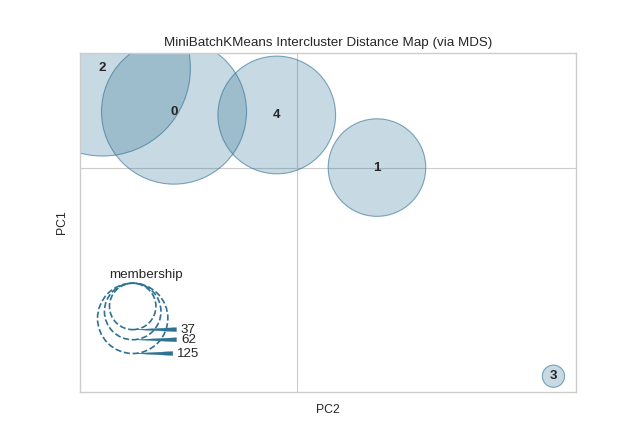
The same functionality above can be achieved with the associated quick method intercluster_distance. This method will build the InterclusterDistance object with the associated arguments, fit it, then (optionally) immediately show it.
from yellowbrick.datasets import load_nfl
from sklearn.cluster import MiniBatchKMeans
from yellowbrick.cluster import intercluster_distance


X, _ = load_nfl()
intercluster_distance(MiniBatchKMeans(5, random_state=777), X)
(Source code, png, pdf)

API Reference
Implements Intercluster Distance Map visualizations.
- class yellowbrick.cluster.icdm.InterclusterDistance(estimator, ax=None, min_size=400, max_size=25000, embedding='mds', scoring='membership', legend=True, legend_loc='lower left', legend_size=1.5, random_state=None, is_fitted='auto', **kwargs)[fuente]
Bases:
ClusteringScoreVisualizerIntercluster distance maps display an embedding of the cluster centers in 2 dimensions with the distance to other centers preserved. E.g. the closer to centers are in the visualization, the closer they are in the original feature space. The clusters are sized according to a scoring metric. By default, they are sized by membership, e.g. the number of instances that belong to each center. This gives a sense of the relative importance of clusters. Note however, that because two clusters overlap in the 2D space, it does not imply that they overlap in the original feature space.
- Parameters
- estimatora Scikit-Learn clusterer
Should be an instance of a centroidal clustering algorithm (or a hierarchical algorithm with a specified number of clusters). Also accepts some other models like LDA for text clustering. If it is not a clusterer, an exception is raised. If the estimator is not fitted, it is fit when the visualizer is fitted, unless otherwise specified by
is_fitted.- axmatplotlib Axes, default: None
The axes to plot the figure on. If None is passed in the current axes will be used (or generated if required).
- min_sizeint, default: 400
The size, in points, of the smallest cluster drawn on the graph. Cluster sizes will be scaled between the min and max sizes.
- max_sizeint, default: 25000
The size, in points, of the largest cluster drawn on the graph. Cluster sizes will be scaled between the min and max sizes.
- embeddingdefault: “mds”
The algorithm used to embed the cluster centers in 2 dimensional space so that the distance between clusters is represented equivalently to their relationship in feature spaceself. Embedding algorithm options include:
mds: multidimensional scaling
tsne: stochastic neighbor embedding
- scoringdefault: “membership”
The scoring method used to determine the size of the clusters drawn on the graph so that the relative importance of clusters can be viewed. Scoring method options include:
membership: number of instances belonging to each cluster
- legendbool, default: True
Whether or not to draw the size legend onto the graph, omit the legend to more easily see clusters that overlap.
- legend_locstr, default: «lower left»
The location of the legend on the graph, used to move the legend out of the way of clusters into open space. The same legend location options for matplotlib are used here.
- legend_sizefloat, default: 1.5
The size, in inches, of the size legend to inset into the graph.
- random_stateint or RandomState, default: None
Fixes the random state for stochastic embedding algorithms.
- is_fittedbool or str, default=”auto”
Specify if the wrapped estimator is already fitted. If False, the estimator will be fit when the visualizer is fit, otherwise, the estimator will not be modified. If “auto” (default), a helper method will check if the estimator is fitted before fitting it again.
- kwargsdict
Keyword arguments passed to the base class and may influence the feature visualization properties.
Notes
Currently the only two embeddings supported are MDS and TSNE. Soon to follow will be PCoA and a customized version of PCoA for LDA. The only supported scoring metric is membership, but in the future, silhouette scores and cluster diameter will be added.
In terms of algorithm support, right now any clustering algorithm that has a learned
cluster_centers_andlabels_attribute will work with the visualizer. In the future, we will update this to work with hierarchical clusterers that haven_componentsand LDA.- Attributes
cluster_centers_array of shape (n_clusters, n_features)Searches for or creates cluster centers for the specified clustering algorithm.
- embedded_centers_array of shape (n_clusters, 2)
The positions of all the cluster centers on the graph.
- scores_array of shape (n_clusters,)
The scores of each cluster that determine its size on the graph.
- fit_time_Timer
The time it took to fit the clustering model and perform the embedding.
- property cluster_centers_
Searches for or creates cluster centers for the specified clustering algorithm. This algorithm ensures that that the centers are appropriately drawn and scaled so that distance between clusters are maintained.
- finalize()[fuente]
Finalize the visualization to create an «origin grid» feel instead of the default matplotlib feel. Set the title, remove spines, and label the grid with components. This function also adds a legend from the sizes if required.
- fit(X, y=None)[fuente]
Fit the clustering model, computing the centers then embeds the centers into 2D space using the embedding method specified.
- property lax
Returns the legend axes, creating it only on demand by creating a 2» by 2» inset axes that has no grid, ticks, spines or face frame (e.g is mostly invisible). The legend can then be drawn on this axes.
- property transformer
Creates the internal transformer that maps the cluster center’s high dimensional space to its two dimensional space.
- yellowbrick.cluster.icdm.intercluster_distance(estimator, X, y=None, ax=None, min_size=400, max_size=25000, embedding='mds', scoring='membership', legend=True, legend_loc='lower left', legend_size=1.5, random_state=None, is_fitted='auto', show=True, **kwargs)[fuente]
Quick Method: Intercluster distance maps display an embedding of the cluster centers in 2 dimensions with the distance to other centers preserved. E.g. the closer to centers are in the visualization, the closer they are in the original feature space. The clusters are sized according to a scoring metric. By default, they are sized by membership, e.g. the number of instances that belong to each center. This gives a sense of the relative importance of clusters. Note however, that because two clusters overlap in the 2D space, it does not imply that they overlap in the original feature space.
- Parameters
- estimatora Scikit-Learn clusterer
Should be an instance of a centroidal clustering algorithm (or a hierarchical algorithm with a specified number of clusters). Also accepts some other models like LDA for text clustering. If it is not a clusterer, an exception is raised. If the estimator is not fitted, it is fit when the visualizer is fitted, unless otherwise specified by
is_fitted.- Xarray-like of shape (n, m)
A matrix or data frame with n instances and m features
- yarray-like of shape (n,), optional
A vector or series representing the target for each instance
- axmatplotlib Axes, default: None
The axes to plot the figure on. If None is passed in the current axes will be used (or generated if required).
- min_sizeint, default: 400
The size, in points, of the smallest cluster drawn on the graph. Cluster sizes will be scaled between the min and max sizes.
- max_sizeint, default: 25000
The size, in points, of the largest cluster drawn on the graph. Cluster sizes will be scaled between the min and max sizes.
- embeddingdefault: “mds”
The algorithm used to embed the cluster centers in 2 dimensional space so that the distance between clusters is represented equivalently to their relationship in feature spaceself. Embedding algorithm options include:
mds: multidimensional scaling
tsne: stochastic neighbor embedding
- scoringdefault: “membership”
The scoring method used to determine the size of the clusters drawn on the graph so that the relative importance of clusters can be viewed. Scoring method options include:
membership: number of instances belonging to each cluster
- legendbool, default: True
Whether or not to draw the size legend onto the graph, omit the legend to more easily see clusters that overlap.
- legend_locstr, default: «lower left»
The location of the legend on the graph, used to move the legend out of the way of clusters into open space. The same legend location options for matplotlib are used here.
- legend_sizefloat, default: 1.5
The size, in inches, of the size legend to inset into the graph.
- random_stateint or RandomState, default: None
Fixes the random state for stochastic embedding algorithms.
- is_fittedbool or str, default=”auto”
Specify if the wrapped estimator is already fitted. If False, the estimator will be fit when the visualizer is fit, otherwise, the estimator will not be modified. If “auto” (default), a helper method will check if the estimator is fitted before fitting it again.
- showbool, default: True
If True, calls
show(), which in turn callsplt.show()however you cannot callplt.savefigfrom this signature, norclear_figure. If False, simply callsfinalize()- kwargsdict
Keyword arguments passed to the base class and may influence the feature visualization properties.
- Returns
- vizInterclusterDistance
The intercluster distance visualizer, fitted and finalized.