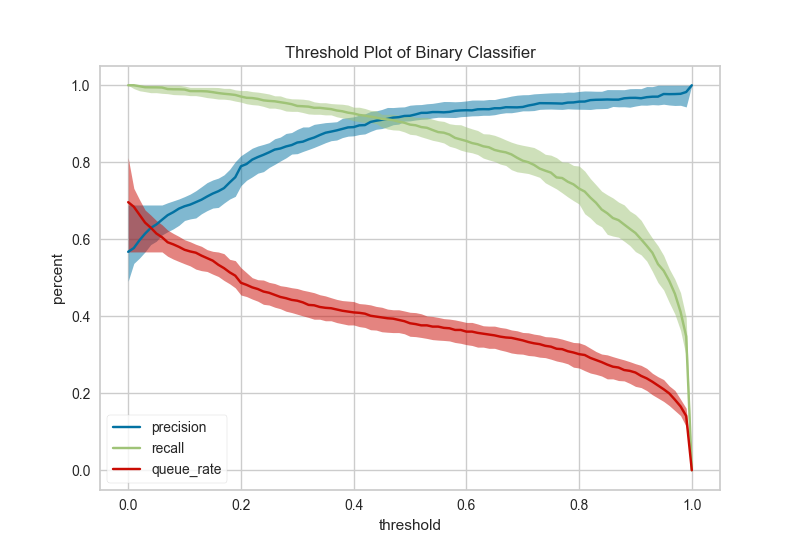
Threshold
The Threshold visualizer shows the bounds of precision, recall and queue rate for different thresholds for binary targets after a given number of trials.
# Load the data set
data = pd.read_csv('https://archive.ics.uci.edu/ml/machine-learning-databases/spambase/spambase.data', header=None)
data.rename(columns={57:'is_spam'}, inplace=True)

features = [col for col in data.columns if col != 'is_spam']

# Extract the numpy arrays from the data frame
X = data[features].as_matrix()
y = data.is_spam.as_matrix()
# Instantiate the classification model and visualizer
logistic = LogisticRegression()
visualizer = ThreshViz(logistic)

visualizer.fit(X, y)  # Fit the training data to the visualizer
g = visualizer.poof() # Draw/show/poof the data