Colors and Style
Yellowbrick believes that visual diagnostics are more effective if visualizations are appealing. As a result, we have borrowed familiar styles from Seaborn and use the new matplotlib 2.0 styles. We hope that these out-of-the-box styles will make your visualizations publication ready, though you can also still customize your own look and feel by directly modifying the visualizations with matplotlib.
For most visualizers, Yellowbrick prioritizes color in its visualizations. There are two types of color sets that can be provided to a visualizer: a palette and a sequence. Palettes are discrete color values usually of a fixed length and are typically used for classification or clustering by showing each class, cluster, or topic. Sequences are continuous color values that do not have a fixed length but rather a range and are typically used for regression or clustering, showing all possible values in the target or distances between items in clusters.
In order to make the distinction easy, most matplotlib colors (both palettes and sequences) can be referred to by name. A complete listing can be imported as follows:
import matplotlib.pyplot as plt
from yellowbrick.style.palettes import PALETTES, SEQUENCES, color_palette
Palettes and sequences can be passed to visualizers as follows:
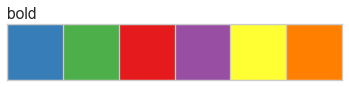
visualizer = Visualizer(color="bold")
Refer to the API listing of each visualizer for specifications on how the color argument is handled. In the next two sections, we will show every possible color palette and sequence currently available in Yellowbrick.
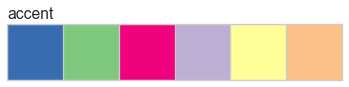
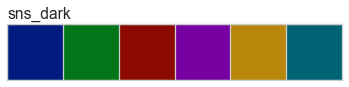
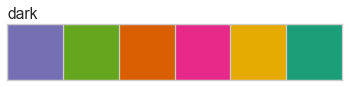
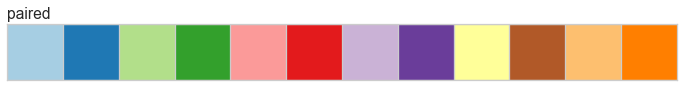
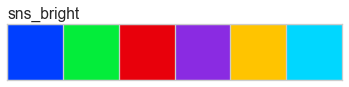
Color Palettes
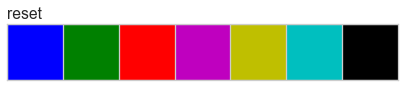
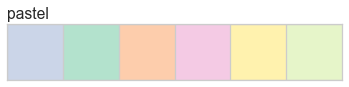
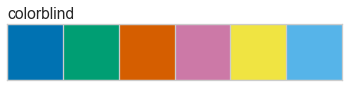
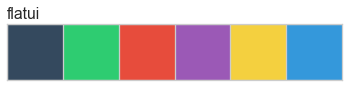
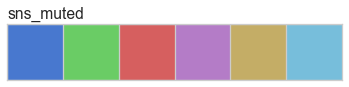
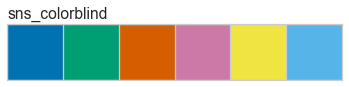
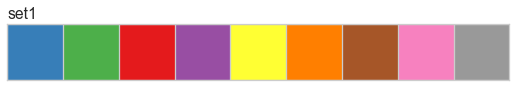
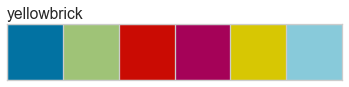
Color palettes are discrete color lists that have a fixed length. The most common palettes are ordered as “blue”, “green”, “red”, “maroon”, “yellow”, “cyan”, and an optional “key”. This allows you to specify these named colors by the first character, e.g. ‘bgrmyck’ for matplotlib visualizations.
To change the global color palette, use the set_palette function as follows:
from yellowbrick.style import set_palette
set_palette('flatui')
Color palettes are most often used for classifiers to show the relationship between discrete class labels. They can also be used for clustering algorithms to show membership in discrete clusters.
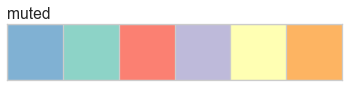
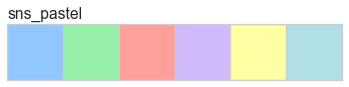
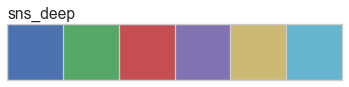
A complete listing of the Yellowbrick color palettes can be visualized as follows:
# ['blue', 'green', 'red', 'maroon', 'yellow', 'cyan']
for palette in PALETTES.keys():
    color_palette(palette).plot()
    plt.title(palette, loc='left')
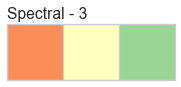
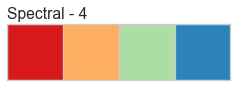
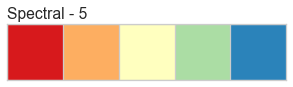
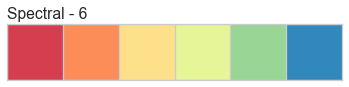
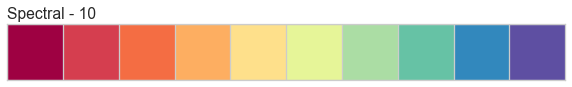
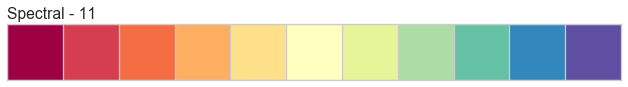
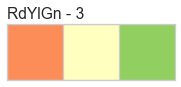
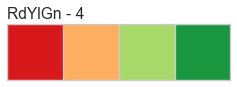
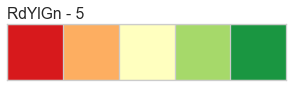
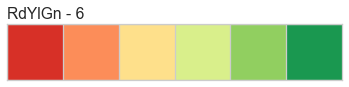
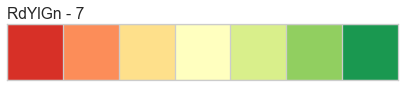
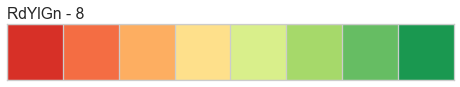
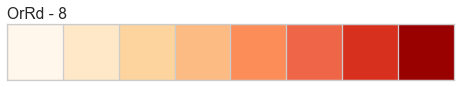
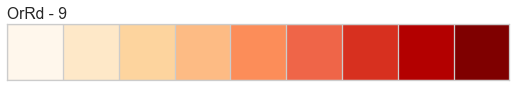
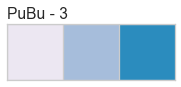
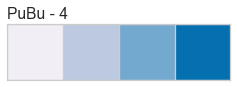
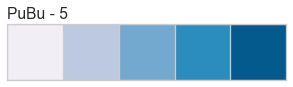
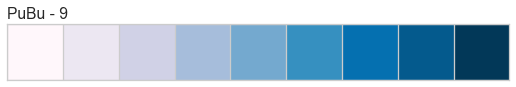
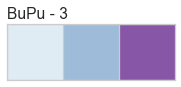
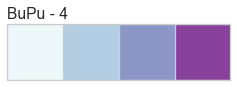
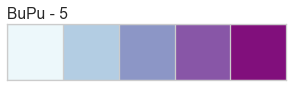
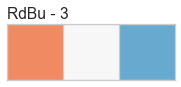
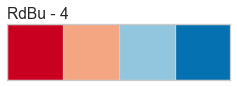
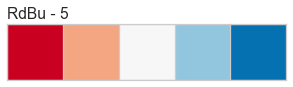
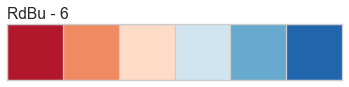
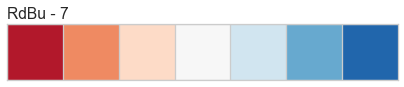
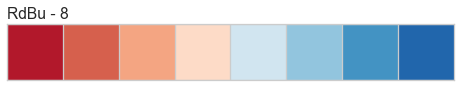
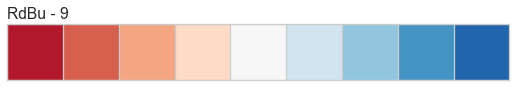
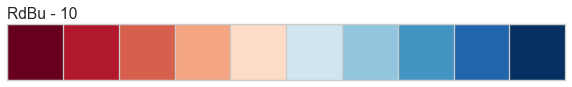
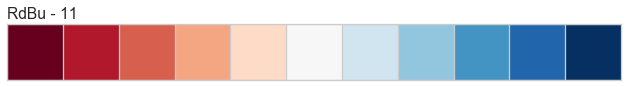
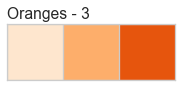
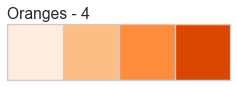
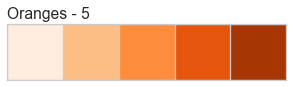
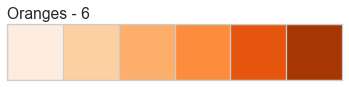
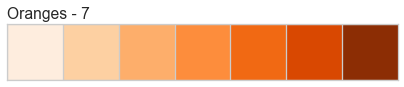
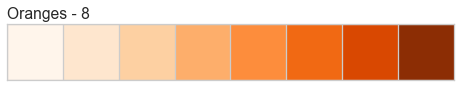
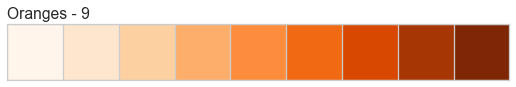
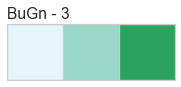
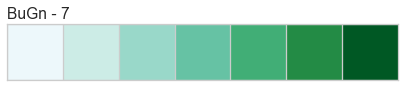
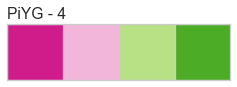
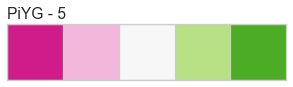
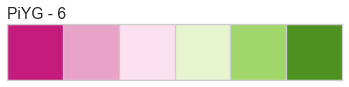
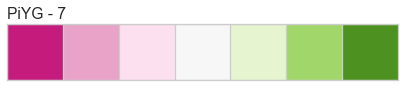
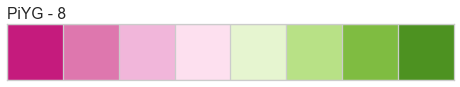
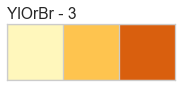
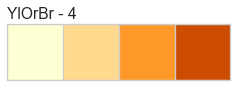
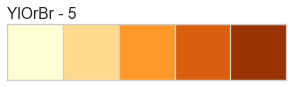
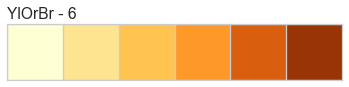
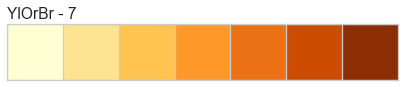
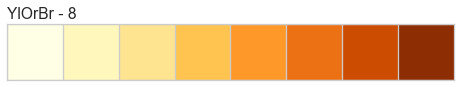
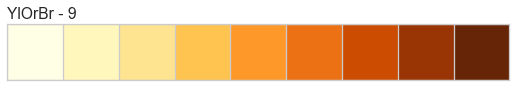
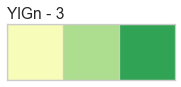
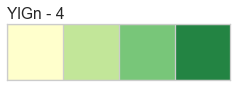
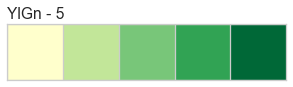
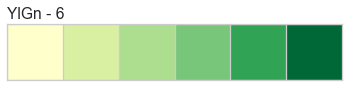
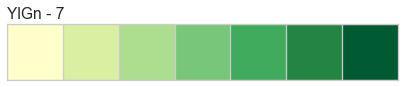
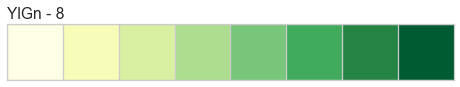
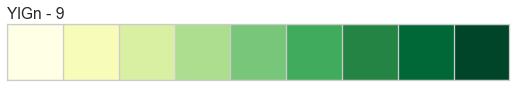
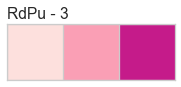
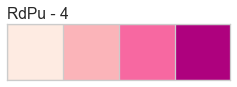
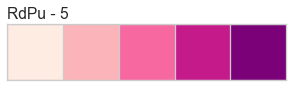
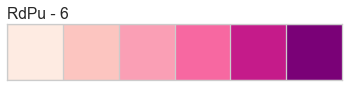
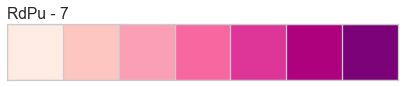
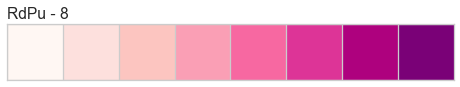
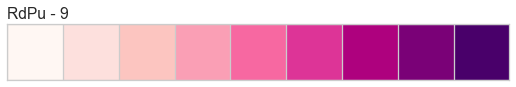
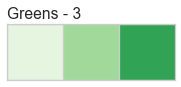
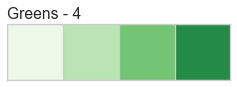
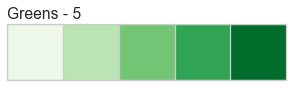
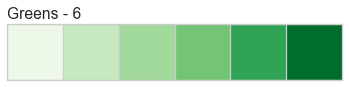
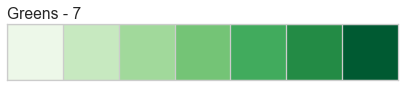
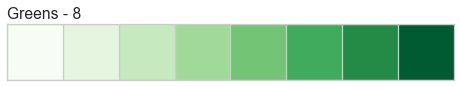
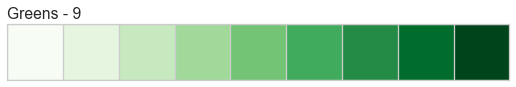
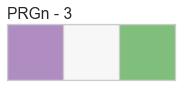
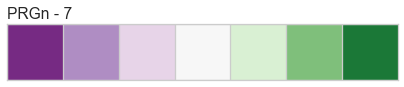
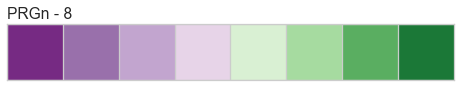
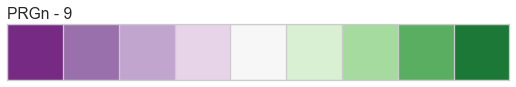
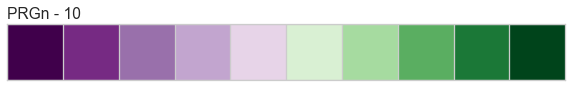
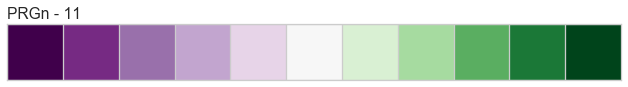
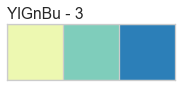
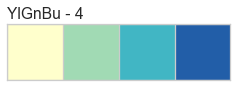
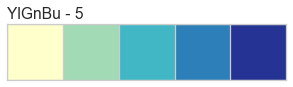
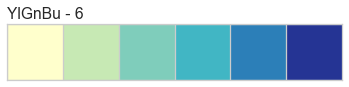
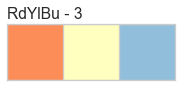
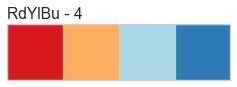
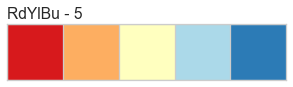
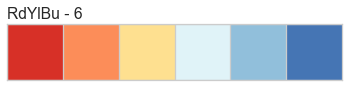
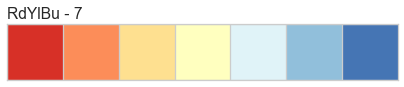
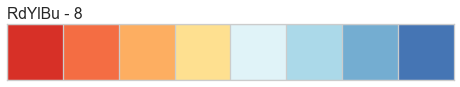
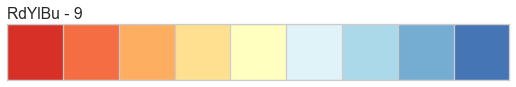
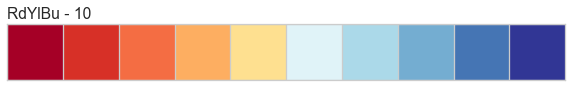
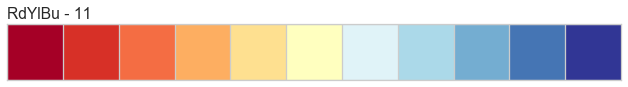
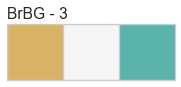
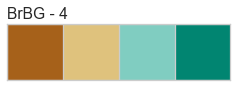
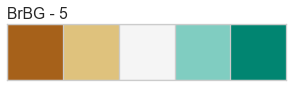
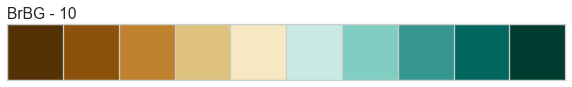
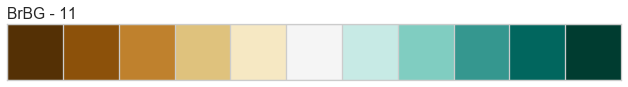
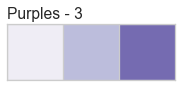
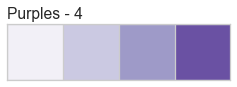
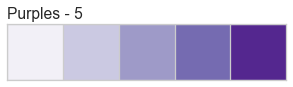
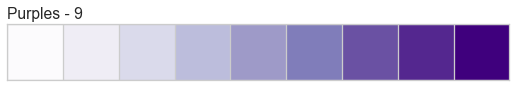
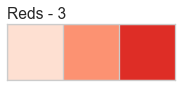
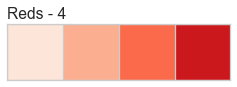
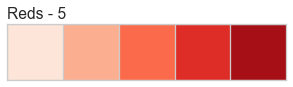
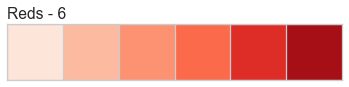
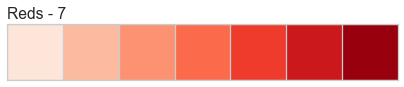
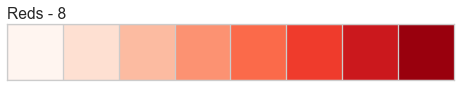
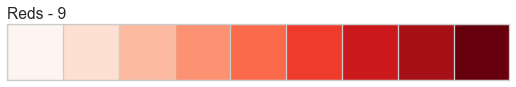
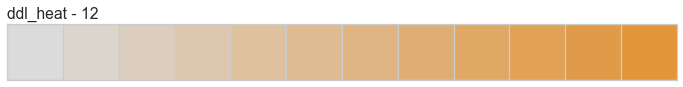
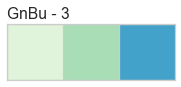
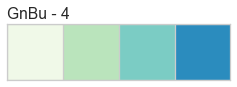
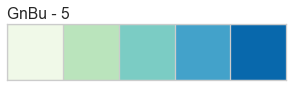
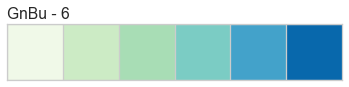
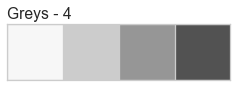
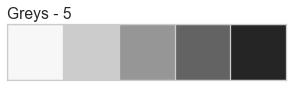
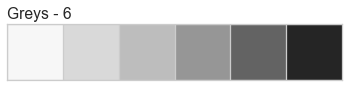
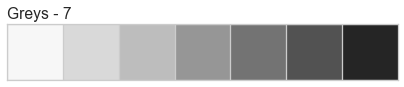
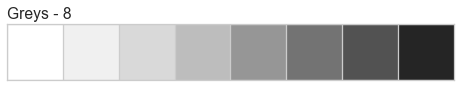
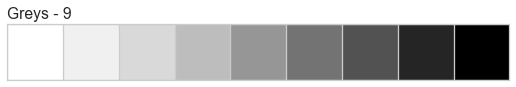
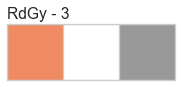
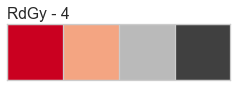
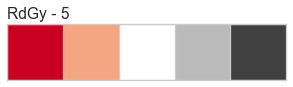
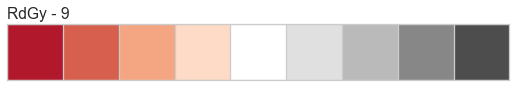
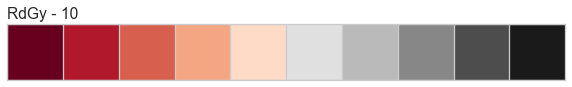
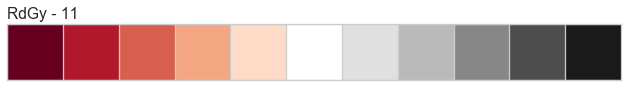
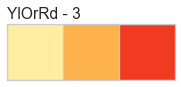
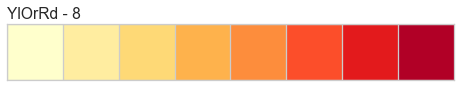
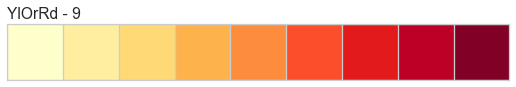
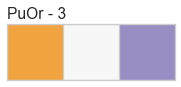
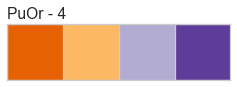
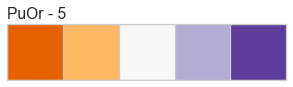
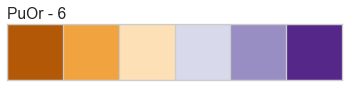
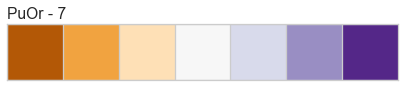
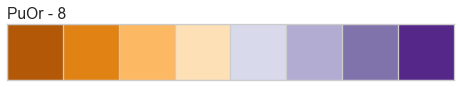
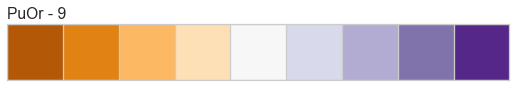
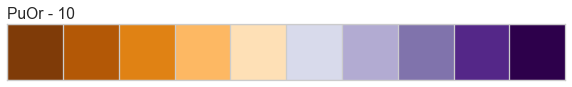
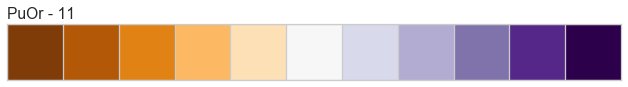
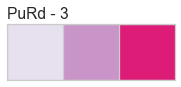
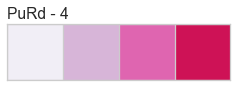
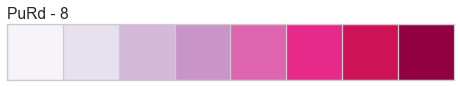
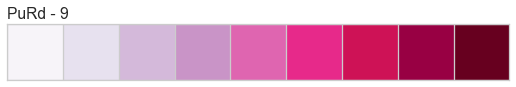
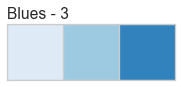
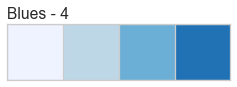
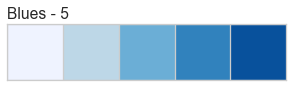
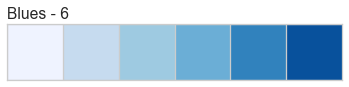
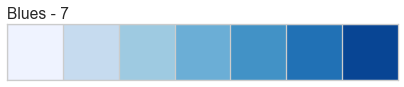
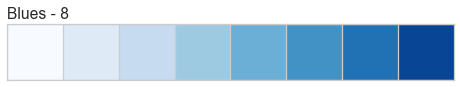
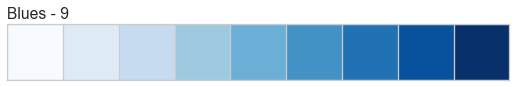
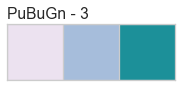
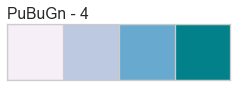
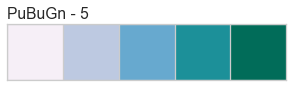
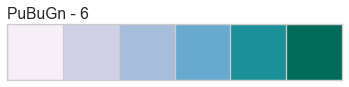
Color Sequences
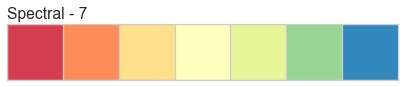
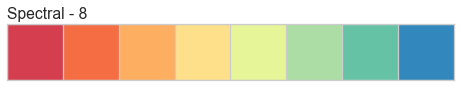
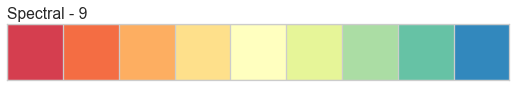
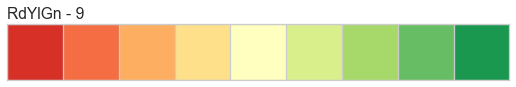
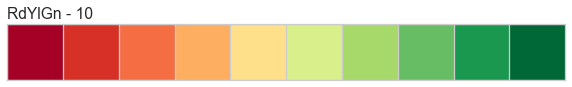
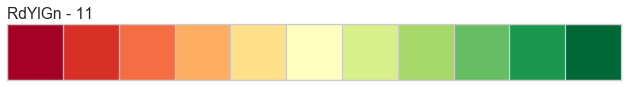
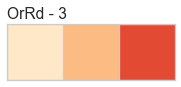
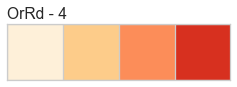
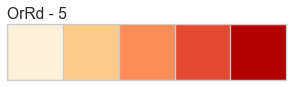
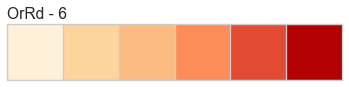
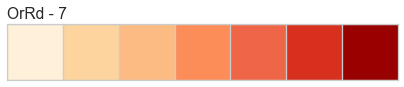
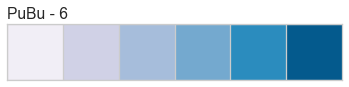
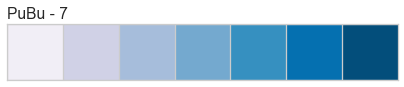
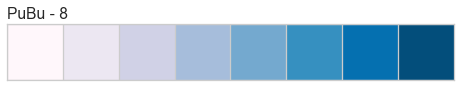
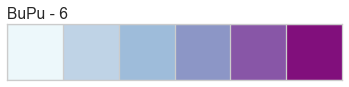
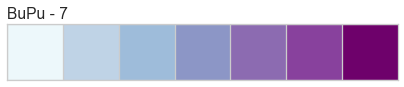
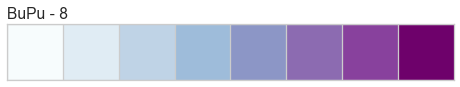
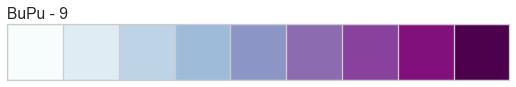
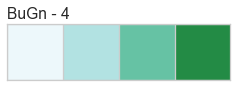
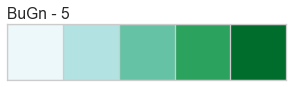
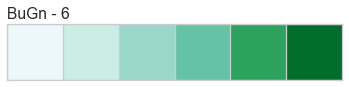
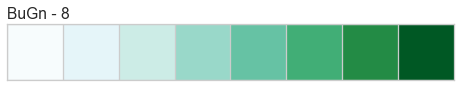
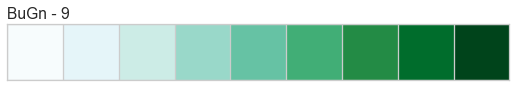
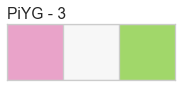
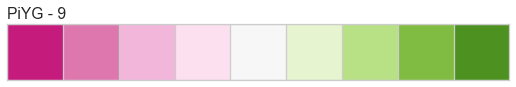
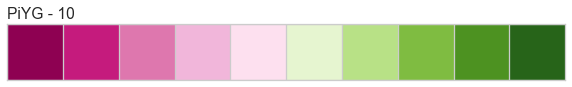
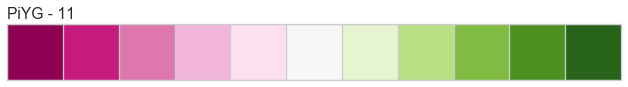
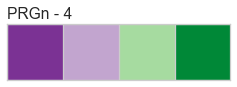
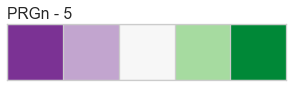
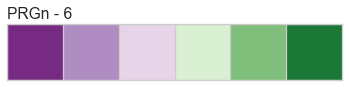
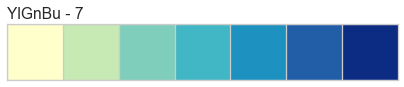
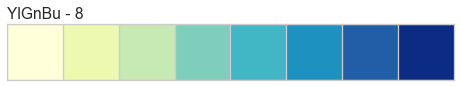
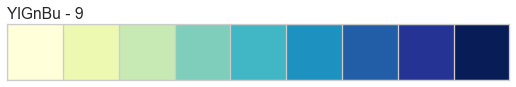
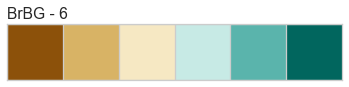
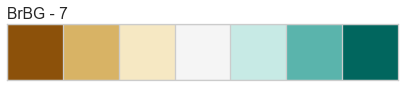
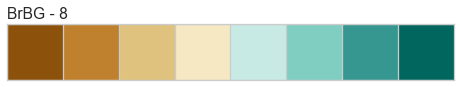
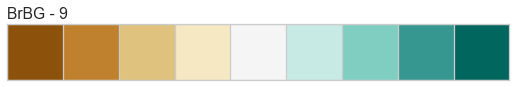
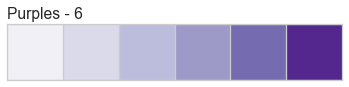
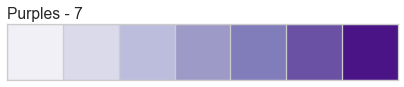
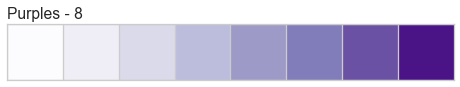
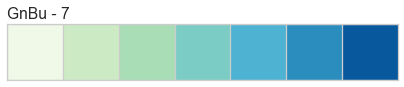
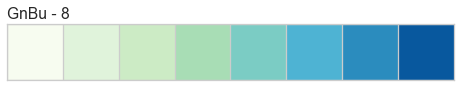
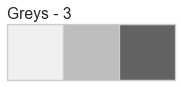
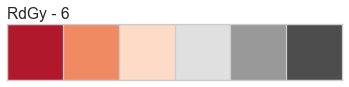
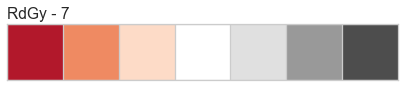
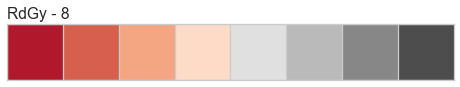
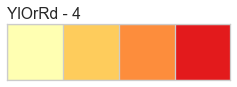
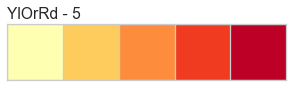
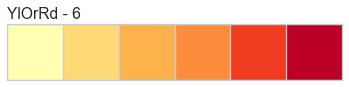
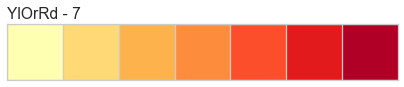
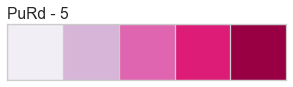
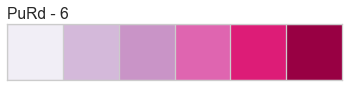
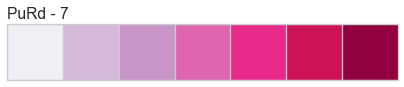
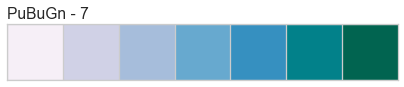
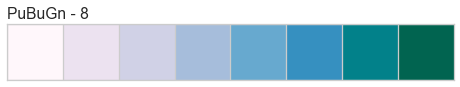
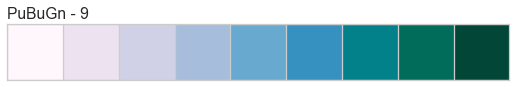
Color sequences are continuous representations of color and are usually defined as a fixed number of steps between a minimum and maximal value. Sequences must be created with a total number of bins (or length) before plotting to ensure that the values are assigned correctly. In the listing below, each sequence is shown with varying lengths to describe the range of colors in detail.
Color sequences are most often used in regressions to show the distribution in the range of target values. They can also be used in clustering and distribution analysis to show distance or histogram data.
Below is a complete listing of all the sequence names available in Yellowbrick:
for name, maps in SEQUENCES.items():
    for num, palette in maps.items():
        color_palette(palette).plot()
        plt.title("{} - {}".format(name, num), loc='left')

API Reference
yellowbrick.style.colors module
Colors and color helpers brought in from an alternate library. See https://bl.ocks.org/mbostock/5577023
- class yellowbrick.style.colors.ColorMap(colors='flatui', shuffle=False)[source]
Bases:
objectA helper for mapping categorical values to colors on demand.
- property colors
- yellowbrick.style.colors.get_color_cycle()[source]
Returns the current color cycle from matplotlib.
- yellowbrick.style.colors.resolve_colors(n_colors=None, colormap=None, colors=None)[source]
Generates a list of colors based on common color arguments, for example the name of a colormap or palette or another iterable of colors. The list is then truncated (or multiplied) to the specific number of requested colors.
- Parameters
- n_colorsint, default: None
Specify the length of the list of returned colors, which will either truncate or multiple the colors available. If None the length of the colors will not be modified.
- colormapstr, yellowbrick.style.palettes.ColorPalette, matplotlib.cm, default: None
The name of the matplotlib color map with which to generate colors.
- colorsiterable, default: None
A collection of colors to use specifically with the plot. Overrides colormap if both are specified.
- Returns
- colorslist
A list of colors that can be used in matplotlib plots.
Notes
This function was originally based on a similar function in the pandas plotting library that has been removed in the new version of the library.
yellowbrick.style.palettes module
Implements the variety of colors that yellowbrick allows access to by name. This code was originally based on Seaborn’s rcmody.py but has since been cleaned up to be Yellowbrick-specific and to dereference tools we don’t use. Note that these functions alter the matplotlib rc dictionary on the fly.
- yellowbrick.style.palettes.color_palette(palette=None, n_colors=None)[source]
Return a color palette object with color definition and handling.
Calling this function with
palette=Nonewill return the current matplotlib color cycle.This function can also be used in a
withstatement to temporarily set the color cycle for a plot or set of plots.- Parameters
- paletteNone or str or sequence
Name of a palette or
Noneto return the current palette. If a sequence the input colors are used but possibly cycled.Available palette names from
yellowbrick.colors.palettesare:accentdarkpairedpastelbold
mutedcolorblindsns_colorblindsns_deepsns_muted
sns_pastelsns_brightsns_darkflatuineural_paint
- n_colorsNone or int
Number of colors in the palette. If
None, the default will depend on howpaletteis specified. Named palettes default to 6 colors which allow the use of the names “bgrmyck”, though others do have more or less colors; therefore reducing the size of the list can only be done by specifying this parameter. Asking for more colors than exist in the palette will cause it to cycle.
- Returns
- list(tuple)
Returns a ColorPalette object, which behaves like a list, but can be used as a context manager and possesses functions to convert colors.
See also
set_palette()Set the default color cycle for all plots.
set_color_codes()Reassign color codes like
"b","g", etc. to colors from one of the yellowbrick palettes.colors.resolve_colors()Resolve a color map or listed sequence of colors.
- yellowbrick.style.palettes.set_color_codes(palette='accent')[source]
Change how matplotlib color shorthands are interpreted.
Calling this will change how shorthand codes like “b” or “g” are interpreted by matplotlib in subsequent plots.
- Parameters
- palettestr
Named yellowbrick palette to use as the source of colors.
See also
set_paletteColor codes can also be set through the function that sets the matplotlib color cycle.
yellowbrick.style.rcmod module
Modifies the matplotlib rcParams in order to make yellowbrick more appealing. This has been modified from Seaborn’s rcmod.py: github.com/mwaskom/seaborn in order to alter the matplotlib rc dictionary on the fly.
NOTE: matplotlib 2.0 styles mean we can simply convert this to a stylesheet!
- yellowbrick.style.rcmod.reset_orig()[source]
Restore all RC params to original settings (respects custom rc).
- yellowbrick.style.rcmod.set_aesthetic(palette='yellowbrick', font='sans-serif', font_scale=1, color_codes=True, rc=None)[source]
Set aesthetic parameters in one step.
Each set of parameters can be set directly or temporarily, see the referenced functions below for more information.
- Parameters
- palettestring or sequence
Color palette, see
color_palette()- fontstring
Font family, see matplotlib font manager.
- font_scalefloat, optional
Separate scaling factor to independently scale the size of the font elements.
- color_codesbool
If
Trueandpaletteis a yellowbrick palette, remap the shorthand color codes (e.g. “b”, “g”, “r”, etc.) to the colors from this palette.- rcdict or None
Dictionary of rc parameter mappings to override the above.
- yellowbrick.style.rcmod.set_palette(palette, n_colors=None, color_codes=False)[source]
Set the matplotlib color cycle using a seaborn palette.
- Parameters
- paletteyellowbrick color palette | seaborn color palette (with
sns_prepended) Palette definition. Should be something that
color_palette()can process.- n_colorsint
Number of colors in the cycle. The default number of colors will depend on the format of
palette, see thecolor_palette()documentation for more information.- color_codesbool
If
Trueandpaletteis a seaborn palette, remap the shorthand color codes (e.g. “b”, “g”, “r”, etc.) to the colors from this palette.
- paletteyellowbrick color palette | seaborn color palette (with
- yellowbrick.style.rcmod.set_style(style=None, rc=None)[source]
Set the aesthetic style of the plots.
This affects things like the color of the axes, whether a grid is enabled by default, and other aesthetic elements.
- Parameters
- styledict, None, or one of {darkgrid, whitegrid, dark, white, ticks}
A dictionary of parameters or the name of a preconfigured set.
- rcdict, optional
Parameter mappings to override the values in the preset seaborn style dictionaries. This only updates parameters that are considered part of the style definition.