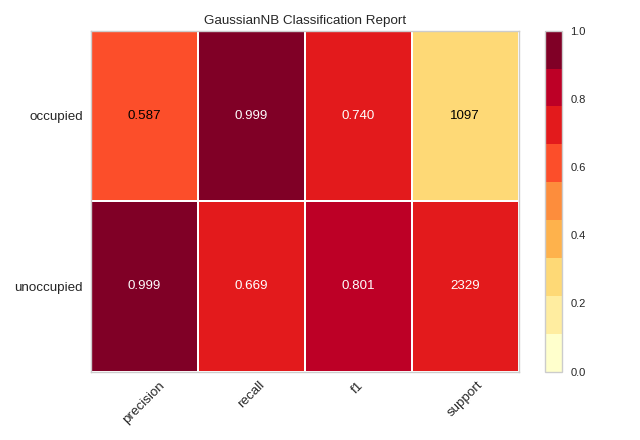
Classification Report
The classification report visualizer displays the precision, recall, F1, and support scores for the model. In order to support easier interpretation and problem detection, the report integrates numerical scores with a color-coded heatmap. All heatmaps are in the range (0.0, 1.0) to facilitate easy comparison of classification models across different classification reports.
Visualizer |
|
Quick Method |
|
Models |
Classification |
Workflow |
Model evaluation |
from sklearn.model_selection import TimeSeriesSplit
from sklearn.naive_bayes import GaussianNB

from yellowbrick.classifier import ClassificationReport
from yellowbrick.datasets import load_occupancy

# Load the classification dataset
X, y = load_occupancy()

# Specify the target classes
classes = ["unoccupied", "occupied"]

# Create the training and test data
tscv = TimeSeriesSplit()
for train_index, test_index in tscv.split(X):
    X_train, X_test = X.iloc[train_index], X.iloc[test_index]
    y_train, y_test = y.iloc[train_index], y.iloc[test_index]

# Instantiate the classification model and visualizer
model = GaussianNB()
visualizer = ClassificationReport(model, classes=classes, support=True)

visualizer.fit(X_train, y_train)        # Fit the visualizer and the model
visualizer.score(X_test, y_test)        # Evaluate the model on the test data
visualizer.show()                       # Finalize and show the figure
(Source code, png, pdf)

The classification report shows a representation of the main classification metrics on a per-class basis. This gives a deeper intuition of the classifier behavior over global accuracy which can mask functional weaknesses in one class of a multiclass problem. Visual classification reports are used to compare classification models to select models that are “redder”, e.g. have stronger classification metrics or that are more balanced.
The metrics are defined in terms of true and false positives, and true and false negatives. Positive and negative in this case are generic names for the classes of a binary classification problem. In the example above, we would consider true and false occupied and true and false unoccupied. Therefore a true positive is when the actual class is positive as is the estimated class. A false positive is when the actual class is negative but the estimated class is positive. Using this terminology the metrics are defined as follows:
- precision
Precision can be seen as a measure of a classifier’s exactness. For each class, it is defined as the ratio of true positives to the sum of true and false positives. Said another way, “for all instances classified positive, what percent was correct?”
- recall
Recall is a measure of the classifier’s completeness; the ability of a classifier to correctly find all positive instances. For each class, it is defined as the ratio of true positives to the sum of true positives and false negatives. Said another way, “for all instances that were actually positive, what percent was classified correctly?”
- f1 score
The F1 score is a weighted harmonic mean of precision and recall such that the best score is 1.0 and the worst is 0.0. Generally speaking, F1 scores are lower than accuracy measures as they embed precision and recall into their computation. As a rule of thumb, the weighted average of F1 should be used to compare classifier models, not global accuracy.
- support
Support is the number of actual occurrences of the class in the specified dataset. Imbalanced support in the training data may indicate structural weaknesses in the reported scores of the classifier and could indicate the need for stratified sampling or rebalancing. Support doesn’t change between models but instead diagnoses the evaluation process.
Note
This example uses TimeSeriesSplit to split the data into the training and test sets. For more information on this cross-validation method, please refer to the scikit-learn documentation.
Quick Method
The same functionality above can be achieved with the associated quick method classification_report. This method
will build the ClassificationReport object with the associated arguments, fit it, then (optionally) immediately
show it.
from sklearn.model_selection import TimeSeriesSplit
from sklearn.naive_bayes import GaussianNB

from yellowbrick.datasets import load_occupancy
from yellowbrick.classifier import classification_report

# Load the classification data set
X, y = load_occupancy()

# Specify the target classes
classes = ["unoccupied", "occupied"]

# Create the training and test data
tscv = TimeSeriesSplit()
for train_index, test_index in tscv.split(X):
    X_train, X_test = X.iloc[train_index], X.iloc[test_index]
    y_train, y_test = y.iloc[train_index], y.iloc[test_index]

# Instantiate the visualizer
visualizer = classification_report(
    GaussianNB(), X_train, y_train, X_test, y_test, classes=classes, support=True
)
(Source code, png, pdf)

API Reference
Visual classification report for classifier scoring.
- class yellowbrick.classifier.classification_report.ClassificationReport(estimator, ax=None, classes=None, cmap='YlOrRd', support=None, encoder=None, is_fitted='auto', force_model=False, colorbar=True, fontsize=None, **kwargs)[source]
Bases:
ClassificationScoreVisualizerClassification report that shows the precision, recall, F1, and support scores for the model. Integrates numerical scores as well as a color-coded heatmap.
- Parameters
- estimatorestimator
A scikit-learn estimator that should be a classifier. If the model is not a classifier, an exception is raised. If the internal model is not fitted, it is fit when the visualizer is fitted, unless otherwise specified by
is_fitted.- axmatplotlib Axes, default: None
The axes to plot the figure on. If not specified the current axes will be used (or generated if required).
- classeslist of str, defult: None
The class labels to use for the legend ordered by the index of the sorted classes discovered in the
fit()method. Specifying classes in this manner is used to change the class names to a more specific format or to label encoded integer classes. Some visualizers may also use this field to filter the visualization for specific classes. For more advanced usage specify an encoder rather than class labels.- cmapstring, default:
'YlOrRd' Specify a colormap to define the heatmap of the predicted class against the actual class in the classification report.
- support: {True, False, None, ‘percent’, ‘count’}, default: None
Specify if support will be displayed. It can be further defined by whether support should be reported as a raw count or percentage.
- encoderdict or LabelEncoder, default: None
A mapping of classes to human readable labels. Often there is a mismatch between desired class labels and those contained in the target variable passed to
fit()orscore(). The encoder disambiguates this mismatch ensuring that classes are labeled correctly in the visualization.- is_fittedbool or str, default=”auto”
Specify if the wrapped estimator is already fitted. If False, the estimator will be fit when the visualizer is fit, otherwise, the estimator will not be modified. If “auto” (default), a helper method will check if the estimator is fitted before fitting it again.
- force_modelbool, default: False
Do not check to ensure that the underlying estimator is a classifier. This will prevent an exception when the visualizer is initialized but may result in unexpected or unintended behavior.
- colorbarbool, default: True
Specify if the color bar should be present
- fontsizeint or None, default: None
Specify the font size of the x and y labels
- kwargsdict
Keyword arguments passed to the visualizer base classes.
Examples
>>> from yellowbrick.classifier import ClassificationReport
>>> from sklearn.linear_model import LogisticRegression
>>> viz = ClassificationReport(LogisticRegression())
>>> viz.fit(X_train, y_train)
>>> viz.score(X_test, y_test)
>>> viz.show()
- Attributes
- classes_ndarray of shape (n_classes,)
The class labels observed while fitting.
- class_count_ndarray of shape (n_classes,)
Number of samples encountered for each class during fitting.
- score_float
An evaluation metric of the classifier on test data produced when
score()is called. This metric is between 0 and 1 – higher scores are generally better. For classifiers, this score is usually accuracy, but ensure you check the underlying model for more details about the score.- scores_dict of dicts
Outer dictionary composed of precision, recall, f1, and support scores with inner dictionaries specifiying the values for each class listed.
- finalize(**kwargs)[source]
Adds a title and sets the axis labels correctly. Also calls tight layout to ensure that no parts of the figure are cut off in the final visualization.
- Parameters
- kwargs: generic keyword arguments.
Notes
Generally this method is called from show and not directly by the user.
- yellowbrick.classifier.classification_report.classification_report(estimator, X_train, y_train, X_test=None, y_test=None, ax=None, classes=None, cmap='YlOrRd', support=None, encoder=None, is_fitted='auto', force_model=False, show=True, colorbar=True, fontsize=None, **kwargs)[source]
Classification Report
Displays precision, recall, F1, and support scores for the model. Integrates numerical scores as well as color-coded heatmap.
- Parameters
- estimatorestimator
A scikit-learn estimator that should be a classifier. If the model is not a classifier, an exception is raised. If the internal model is not fitted, it is fit when the visualizer is fitted, unless otherwise specified by
is_fitted.- X_trainndarray or DataFrame of shape n x m
A feature array of n instances with m features the model is trained on. Used to fit the visualizer and also to score the visualizer if test splits are not directly specified.
- y_trainndarray or Series of length n
An array or series of target or class values. Used to fit the visualizer and also to score the visualizer if test splits are not specified.
- X_testndarray or DataFrame of shape n x m, default: None
An optional feature array of n instances with m features that the model is scored on if specified, using X_train as the training data.
- y_testndarray or Series of length n, default: None
An optional array or series of target or class values that serve as actual labels for X_test for scoring purposes.
- axmatplotlib Axes, default: None
The axes to plot the figure on. If not specified the current axes will be used (or generated if required).
- classeslist of str, defult: None
The class labels to use for the legend ordered by the index of the sorted classes discovered in the
fit()method. Specifying classes in this manner is used to change the class names to a more specific format or to label encoded integer classes. Some visualizers may also use this field to filter the visualization for specific classes. For more advanced usage specify an encoder rather than class labels.- cmapstring, default:
'YlOrRd' Specify a colormap to define the heatmap of the predicted class against the actual class in the classification report.
- support: {True, False, None, ‘percent’, ‘count’}, default: None
Specify if support will be displayed. It can be further defined by whether support should be reported as a raw count or percentage.
- encoderdict or LabelEncoder, default: None
A mapping of classes to human readable labels. Often there is a mismatch between desired class labels and those contained in the target variable passed to
fit()orscore(). The encoder disambiguates this mismatch ensuring that classes are labeled correctly in the visualization.- is_fittedbool or str, default=’auto’
Specify if the wrapped estimator is already fitted. If False, the estimator will be fit when the visualizer is fit, otherwise, the estimator will not be modified. If ‘auto’ (default), a helper method will check if the estimator is fitted before fitting it again.
- force_modelbool, default: False
Do not check to ensure that the underlying estimator is a classifier. This will prevent an exception when the visualizer is initialized but may result in unexpected or unintended behavior.
- show: bool, default: True
If True, calls
show(), which in turn callsplt.show()however you cannot callplt.savefigfrom this signature, norclear_figure. If False, simply callsfinalize()- colorbarbool, default: True
Specify if the color bar should be present
- fontsizeint or None, default: None
Specify the font size of the x and y labels
- kwargsdict
Keyword arguments passed to the visualizer base classes.
- Returns
- vizClassificationReport
Returns the fitted, finalized visualizer