Precision-Recall Curves
The PrecisionRecallCurve shows the tradeoff between a classifier’s precision, a measure of result relevancy, and recall, a measure of completeness. For each class, precision is defined as the ratio of true positives to the sum of true and false positives, and recall is the ratio of true positives to the sum of true positives and false negatives.
Visualizer |
|
Quick Method |
|
Models |
Classification |
Workflow |
Model evaluation |
- precision
Precision can be seen as a measure of a classifier’s exactness. For each class, it is defined as the ratio of true positives to the sum of true and false positives. Said another way, “for all instances classified positive, what percent was correct?”
- recall
Recall is a measure of the classifier’s completeness; the ability of a classifier to correctly find all positive instances. For each class, it is defined as the ratio of true positives to the sum of true positives and false negatives. Said another way, “for all instances that were actually positive, what percent was classified correctly?”
- average precision
Average precision expresses the precision-recall curve in a single number, which represents the area under the curve. It is computed as the weighted average of precision achieved at each threshold, where the weights are the differences in recall from the previous thresholds.
Both precision and recall vary between 0 and 1, and in our efforts to select and tune machine learning models, our goal is often to try to maximize both precision and recall, i.e. a model that returns accurate results for the majority of classes it selects. This would result in a PrecisionRecallCurve visualization with a high area under the curve.
Binary Classification
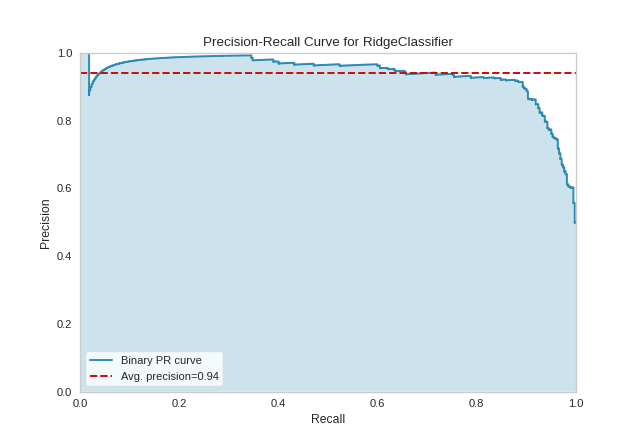
The base case for precision-recall curves is the binary classification case, and this case is also the most visually interpretable. In the figure below we can see the precision plotted on the y-axis against the recall on the x-axis. The larger the filled in area, the stronger the classifier. The red line annotates the average precision.
import matplotlib.pyplot as plt

from yellowbrick.datasets import load_spam
from sklearn.linear_model import RidgeClassifier
from yellowbrick.classifier import PrecisionRecallCurve
from sklearn.model_selection import train_test_split as tts

# Load the dataset and split into train/test splits
X, y = load_spam()

X_train, X_test, y_train, y_test = tts(
    X, y, test_size=0.2, shuffle=True, random_state=0
)

# Create the visualizer, fit, score, and show it
viz = PrecisionRecallCurve(RidgeClassifier(random_state=0))
viz.fit(X_train, y_train)
viz.score(X_test, y_test)
viz.show()
(Source code, png, pdf)

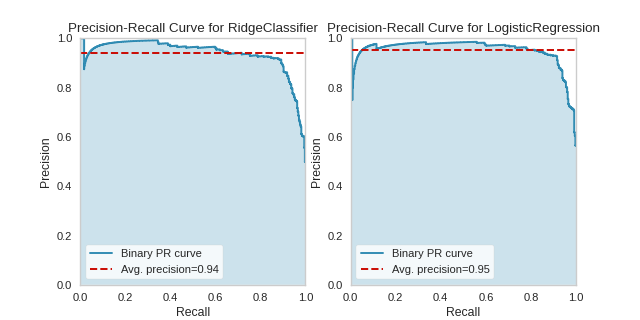
One way to use PrecisionRecallCurves is for model comparison, by examining which have the highest average precision. For instance, the below visualization suggest that a LogisticRegression model might be better than a RidgeClassifier for this particular dataset:
(Source code, png, pdf)
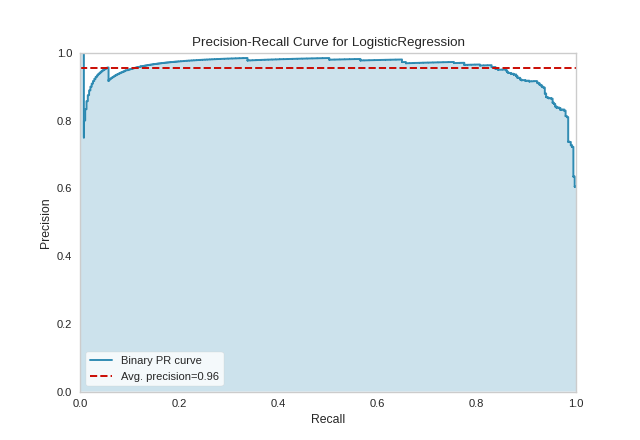
Precision-recall curves are one of the methods used to evaluate a classifier’s quality, particularly when classes are very imbalanced. The below plot suggests that our classifier improves when we increase the weight of the “spam” case (which is 1), and decrease the weight for the “not spam” case (which is 0).
from yellowbrick.datasets import load_spam
from sklearn.linear_model import LogisticRegression
from yellowbrick.classifier import PrecisionRecallCurve
from sklearn.model_selection import train_test_split as tts

# Load the dataset and split into train/test splits
X, y = load_spam()

X_train, X_test, y_train, y_test = tts(
    X, y, test_size=0.2, shuffle=True, random_state=0
)

# Specify class weights to shift the threshold towards spam classification
weights = {0:0.2, 1:0.8}

# Create the visualizer, fit, score, and show it
viz = PrecisionRecallCurve(
    LogisticRegression(class_weight=weights, random_state=0)
)
viz.fit(X_train, y_train)
viz.score(X_test, y_test)
viz.show()
(Source code, png, pdf)
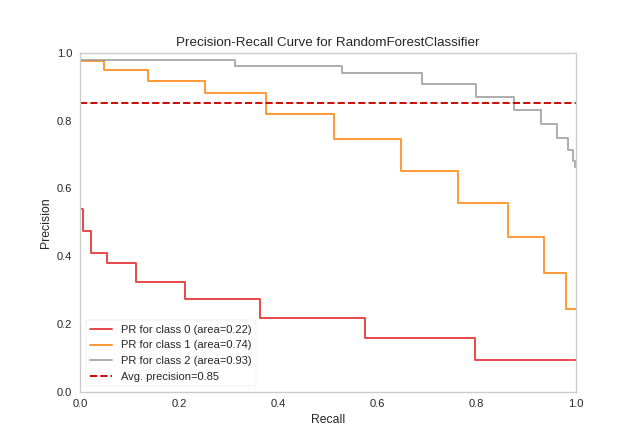
Multi-Label Classification
To support multi-label classification, the estimator is wrapped in a OneVsRestClassifier to produce binary comparisons for each class (e.g. the positive case is the class and the negative case is any other class). The precision-recall curve can then be computed as the micro-average of the precision and recall for all classes (by setting micro=True), or individual curves can be plotted for each class (by setting per_class=True):
from sklearn.ensemble import RandomForestClassifier
from sklearn.preprocessing import LabelEncoder, OrdinalEncoder
from sklearn.model_selection import train_test_split as tts
from yellowbrick.classifier import PrecisionRecallCurve
from yellowbrick.datasets import load_game

# Load dataset and encode categorical variables
X, y = load_game()
X = OrdinalEncoder().fit_transform(X)
y = LabelEncoder().fit_transform(y)

X_train, X_test, y_train, y_test = tts(X, y, test_size=0.2, shuffle=True)

# Create the visualizer, fit, score, and show it
viz = PrecisionRecallCurve(
    RandomForestClassifier(n_estimators=10),
    per_class=True,
    cmap="Set1"
)
viz.fit(X_train, y_train)
viz.score(X_test, y_test)
viz.show()
(Source code, png, pdf)
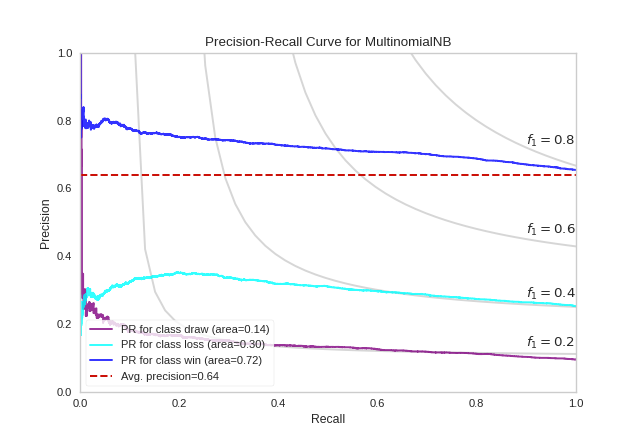
A more complex Precision-Recall curve can be computed, however, displaying the each curve individually, along with F1-score ISO curves (e.g. that show the relationship between precision and recall for various F1 scores).
from sklearn.naive_bayes import MultinomialNB
from sklearn.preprocessing import LabelEncoder, OrdinalEncoder
from sklearn.model_selection import train_test_split as tts
from yellowbrick.classifier import PrecisionRecallCurve
from yellowbrick.datasets import load_game

# Load dataset and encode categorical variables
X, y = load_game()
X = OrdinalEncoder().fit_transform(X)

# Encode the target (we'll use the encoder to retrieve the class labels)
encoder = LabelEncoder()
y = encoder.fit_transform(y)

X_train, X_test, y_train, y_test = tts(X, y, test_size=0.2, shuffle=True)

# Create the visualizer, fit, score, and show it
viz = PrecisionRecallCurve(
    MultinomialNB(),
    classes=encoder.classes_,
    colors=["purple", "cyan", "blue"],
    iso_f1_curves=True,
    per_class=True,
    micro=False
)
viz.fit(X_train, y_train)
viz.score(X_test, y_test)
viz.show()
(Source code, png, pdf)
Quick Method
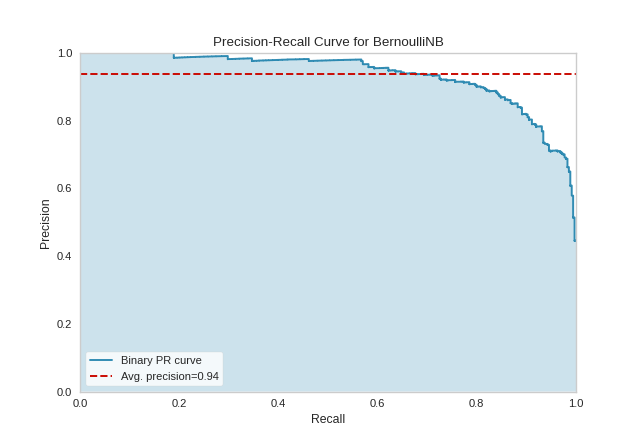
Similar functionality as above can be achieved in one line using the associated quick method, precision_recall_curve. This method will instantiate and fit a PrecisionRecallCurve visualizer on the training data, then will score it on the optionally provided test data (or the training data if it is not provided).
from sklearn.naive_bayes import BernoulliNB
from sklearn.model_selection import train_test_split as tts
from yellowbrick.classifier import precision_recall_curve
from yellowbrick.datasets import load_spam

# Load the dataset and split into train/test splits
X, y = load_spam()

X_train, X_test, y_train, y_test = tts(X, y, test_size=0.2, shuffle=True)

# Create the visualizer, fit, score, and show it
viz = precision_recall_curve(BernoulliNB(), X_train, y_train, X_test, y_test)
(Source code, png, pdf)

API Reference
Implements Precision-Recall curves for classification models.
- class yellowbrick.classifier.prcurve.PrecisionRecallCurve(estimator, ax=None, classes=None, colors=None, cmap=None, encoder=None, fill_area=True, ap_score=True, micro=True, iso_f1_curves=False, iso_f1_values=(0.2, 0.4, 0.6, 0.8), per_class=False, fill_opacity=0.2, line_opacity=0.8, is_fitted='auto', force_model=False, **kwargs)[source]
Bases:
ClassificationScoreVisualizerPrecision-Recall curves are a metric used to evaluate a classifier’s quality, particularly when classes are very imbalanced. The precision-recall curve shows the tradeoff between precision, a measure of result relevancy, and recall, a measure of completeness. For each class, precision is defined as the ratio of true positives to the sum of true and false positives, and recall is the ratio of true positives to the sum of true positives and false negatives.
A large area under the curve represents both high recall and precision, the best case scenario for a classifier, showing a model that returns accurate results for the majority of classes it selects.
- Parameters
- estimatorestimator
A scikit-learn estimator that should be a classifier. If the model is not a classifier, an exception is raised. If the internal model is not fitted, it is fit when the visualizer is fitted, unless otherwise specified by
is_fitted.- axmatplotlib Axes, default: None
The axes to plot the figure on. If not specified the current axes will be used (or generated if required).
- classeslist of str, default: None
The class labels to use for the legend ordered by the index of the sorted classes discovered in the
fit()method. Specifying classes in this manner is used to change the class names to a more specific format or to label encoded integer classes. Some visualizers may also use this field to filter the visualization for specific classes. For more advanced usage specify an encoder rather than class labels.- colorslist of strings, default: None
An optional list or tuple of colors to colorize the curves when
per_class=True. Ifper_class=False, this parameter will be ignored. If bothcolorsandcmapare provided,cmapwill be ignored.- cmapstring or Matplotlib colormap, default: None
An optional string or Matplotlib colormap to colorize the curves when
per_class=True. Ifper_class=False, this parameter will be ignored. If bothcolorsandcmapare provided,cmapwill be ignored.- encoderdict or LabelEncoder, default: None
A mapping of classes to human readable labels. Often there is a mismatch between desired class labels and those contained in the target variable passed to
fit()orscore(). The encoder disambiguates this mismatch ensuring that classes are labeled correctly in the visualization.- fill_areabool, default: True
Fill the area under the curve (or curves) with the curve color.
- ap_scorebool, default: True
Annotate the graph with the average precision score, a summary of the plot that is computed as the weighted mean of precisions at each threshold, with the increase in recall from the previous threshold used as the weight.
- microbool, default: True
If multi-class classification, draw the precision-recall curve for the micro-average of all classes. In the multi-class case, either micro or per-class must be set to True. Ignored in the binary case.
- iso_f1_curvesbool, default: False
Draw ISO F1-Curves on the plot to show how close the precision-recall curves are to different F1 scores.
- iso_f1_valuestuple , default: (0.2, 0.4, 0.6, 0.8)
Values of f1 score for which to draw ISO F1-Curves
- per_classbool, default: False
If multi-class classification, draw the precision-recall curve for each class using a OneVsRestClassifier to compute the recall on a per-class basis. In the multi-class case, either micro or per-class must be set to True. Ignored in the binary case.
- fill_opacityfloat, default: 0.2
Specify the alpha or opacity of the fill area (0 being transparent, and 1.0 being completly opaque).
- line_opacityfloat, default: 0.8
Specify the alpha or opacity of the lines (0 being transparent, and 1.0 being completly opaque).
- is_fittedbool or str, default=”auto”
Specify if the wrapped estimator is already fitted. If False, the estimator will be fit when the visualizer is fit, otherwise, the estimator will not be modified. If “auto” (default), a helper method will check if the estimator is fitted before fitting it again.
- force_modelbool, default: False
Do not check to ensure that the underlying estimator is a classifier. This will prevent an exception when the visualizer is initialized but may result in unexpected or unintended behavior.
- kwargsdict
Keyword arguments passed to the visualizer base classes.
Notes
To support multi-label classification, the estimator is wrapped in a
OneVsRestClassifierto produce binary comparisons for each class (e.g. the positive case is the class and the negative case is any other class). The precision-recall curve can then be computed as the micro-average of the precision and recall for all classes (by setting micro=True), or individual curves can be plotted for each class (by setting per_class=True).Note also that some parameters of this visualizer are learned on the
scoremethod, not only onfit.See also
Examples
>>> from yellowbrick.classifier import PrecisionRecallCurve
>>> from sklearn.model_selection import train_test_split
>>> from sklearn.svm import LinearSVC
>>> X_train, X_test, y_train, y_test = train_test_split(X, y)
>>> viz = PrecisionRecallCurve(LinearSVC())
>>> viz.fit(X_train, y_train)
>>> viz.score(X_test, y_test)
>>> viz.show()
- Attributes
- target_type_str
Either
"binary"or"multiclass"depending on the type of target fit to the visualizer. If"multiclass"then the estimator is wrapped in a OneVsRestClassifier classification strategy.- score_float or dict of floats
Average precision, a summary of the plot as a weighted mean of precision at each threshold, weighted by the increase in recall from the previous threshold. In the multiclass case, a mapping of class/metric to the average precision score.
- precision_array or dict of array with shape=[n_thresholds + 1]
Precision values such that element i is the precision of predictions with score >= thresholds[i] and the last element is 1. In the multiclass case, a mapping of class/metric to precision array.
- recall_array or dict of array with shape=[n_thresholds + 1]
Decreasing recall values such that element i is the recall of predictions with score >= thresholds[i] and the last element is 0. In the multiclass case, a mapping of class/metric to recall array.
- classes_ndarray of shape (n_classes,)
The class labels observed while fitting.
- class_count_ndarray of shape (n_classes,)
Number of samples encountered for each class during fitting.
- yellowbrick.classifier.prcurve.precision_recall_curve(estimator, X_train, y_train, X_test=None, y_test=None, ax=None, classes=None, colors=None, cmap=None, encoder=None, fill_area=True, ap_score=True, micro=True, iso_f1_curves=False, iso_f1_values=(0.2, 0.4, 0.6, 0.8), per_class=False, fill_opacity=0.2, line_opacity=0.8, is_fitted='auto', force_model=False, show=True, **kwargs)[source]
Precision-Recall Curve
Precision-Recall curves are a metric used to evaluate a classifier’s quality, particularly when classes are very imbalanced. The precision-recall curve shows the tradeoff between precision, a measure of result relevancy, and recall, a measure of completeness. For each class, precision is defined as the ratio of true positives to the sum of true and false positives, and recall is the ratio of true positives to the sum of true positives and false negatives.
A large area under the curve represents both high recall and precision, the best case scenario for a classifier, showing a model that returns accurate results for the majority of classes it selects.
- Parameters
- estimatorestimator
A scikit-learn estimator that should be a classifier. If the model is not a classifier, an exception is raised. If the internal model is not fitted, it is fit when the visualizer is fitted, unless otherwise specified by
is_fitted.- X_trainndarray or DataFrame of shape n x m
A feature array of n instances with m features the model is trained on. Used to fit the visualizer and also to score the visualizer if test splits are not directly specified.
- y_trainndarray or Series of length n
An array or series of target or class values. Used to fit the visualizer and also to score the visualizer if test splits are not specified.
- X_testndarray or DataFrame of shape n x m, default: None
An optional feature array of n instances with m features that the model is scored on if specified, using X_train as the training data.
- y_testndarray or Series of length n, default: None
An optional array or series of target or class values that serve as actual labels for X_test for scoring purposes.
- axmatplotlib Axes, default: None
The axes to plot the figure on. If not specified the current axes will be used (or generated if required).
- classeslist of str, default: None
The class labels to use for the legend ordered by the index of the sorted classes discovered in the
fit()method. Specifying classes in this manner is used to change the class names to a more specific format or to label encoded integer classes. Some visualizers may also use this field to filter the visualization for specific classes. For more advanced usage specify an encoder rather than class labels.- colorslist of strings, default: None
An optional list or tuple of colors to colorize the curves when
per_class=True. Ifper_class=False, this parameter will be ignored. If bothcolorsandcmapare provided,cmapwill be ignored.- cmapstring or Matplotlib colormap, default: None
An optional string or Matplotlib colormap to colorize the curves when
per_class=True. Ifper_class=False, this parameter will be ignored. If bothcolorsandcmapare provided,cmapwill be ignored.- encoderdict or LabelEncoder, default: None
A mapping of classes to human readable labels. Often there is a mismatch between desired class labels and those contained in the target variable passed to
fit()orscore(). The encoder disambiguates this mismatch ensuring that classes are labeled correctly in the visualization.- fill_areabool, default: True
Fill the area under the curve (or curves) with the curve color.
- ap_scorebool, default: True
Annotate the graph with the average precision score, a summary of the plot that is computed as the weighted mean of precisions at each threshold, with the increase in recall from the previous threshold used as the weight.
- microbool, default: True
If multi-class classification, draw the precision-recall curve for the micro-average of all classes. In the multi-class case, either micro or per-class must be set to True. Ignored in the binary case.
- iso_f1_curvesbool, default: False
Draw ISO F1-Curves on the plot to show how close the precision-recall curves are to different F1 scores.
- iso_f1_valuestuple , default: (0.2, 0.4, 0.6, 0.8)
Values of f1 score for which to draw ISO F1-Curves
- per_classbool, default: False
If multi-class classification, draw the precision-recall curve for each class using a OneVsRestClassifier to compute the recall on a per-class basis. In the multi-class case, either micro or per-class must be set to True. Ignored in the binary case.
- fill_opacityfloat, default: 0.2
Specify the alpha or opacity of the fill area (0 being transparent, and 1.0 being completly opaque).
- line_opacityfloat, default: 0.8
Specify the alpha or opacity of the lines (0 being transparent, and 1.0 being completly opaque).
- is_fittedbool or str, default=”auto”
Specify if the wrapped estimator is already fitted. If False, the estimator will be fit when the visualizer is fit, otherwise, the estimator will not be modified. If “auto” (default), a helper method will check if the estimator is fitted before fitting it again.
- force_modelbool, default: False
Do not check to ensure that the underlying estimator is a classifier. This will prevent an exception when the visualizer is initialized but may result in unexpected or unintended behavior.
- show: bool, default: True
If True, calls
show(), which in turn callsplt.show()however you cannot callplt.savefigfrom this signature, norclear_figure. If False, simply callsfinalize()- kwargsdict
Keyword arguments passed to the visualizer base classes.
- Returns
- vizPrecisionRecallCurve
Returns the visualizer that generates the curve visualization.