Cross Validation Scores
Visualizer |
|
Quick Method |
|
Models |
Classification, Regression |
Workflow |
Model Selection |
Generally we determine whether a given model is optimal by looking at it’s F1, precision, recall, and accuracy (for classification), or it’s coefficient of determination (R2) and error (for regression). However, real world data is often distributed somewhat unevenly, meaning that the fitted model is likely to perform better on some sections of the data than on others. Yellowbrick’s CVScores visualizer enables us to visually explore these variations in performance using different cross validation strategies.
Cross Validation
Cross-validation starts by shuffling the data (to prevent any unintentional ordering errors) and splitting it into k folds. Then k models are fit on \(\frac{k-1} {k}\) of the data (called the training split) and evaluated on \(\frac {1} {k}\) of the data (called the test split). The results from each evaluation are averaged together for a final score, then the final model is fit on the entire dataset for operationalization.
In Yellowbrick, the CVScores visualizer displays cross-validated scores as a bar chart (one bar for each fold) with the average score across all folds plotted as a horizontal dotted line.
Classification
In the following example, we show how to visualize cross-validated scores for a classification model. After loading our occupancy data as a DataFrame, we created a StratifiedKFold cross-validation strategy to ensure all of our classes in each split are represented with the same proportion. We then fit the CVScores visualizer using the f1_weighted scoring metric as opposed to the default metric, accuracy, to get a better sense of the relationship of precision and recall in our classifier across all of our folds.
from sklearn.model_selection import StratifiedKFold
from sklearn.naive_bayes import MultinomialNB

from yellowbrick.datasets import load_occupancy
from yellowbrick.model_selection import CVScores

# Load the classification dataset
X, y = load_occupancy()

# Create a cross-validation strategy
cv = StratifiedKFold(n_splits=12, shuffle=True, random_state=42)

# Instantiate the classification model and visualizer
model = MultinomialNB()
visualizer = CVScores(model, cv=cv, scoring='f1_weighted')

visualizer.fit(X, y)        # Fit the data to the visualizer
visualizer.show()           # Finalize and render the figure
(Source code, png, pdf)
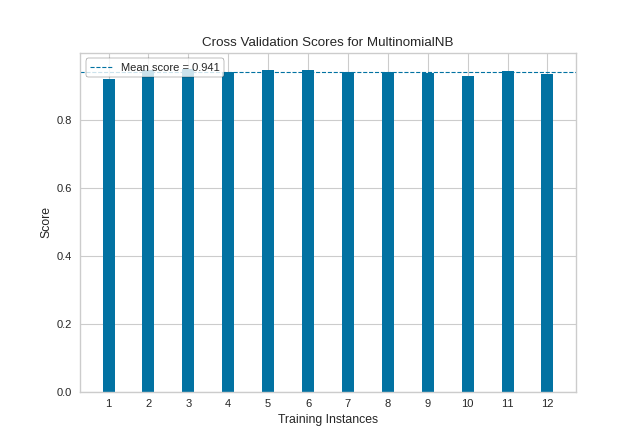
Our resulting visualization shows that while our average cross-validation score is quite high, there are some splits for which our fitted MultinomialNB classifier performs significantly less well.
Regression
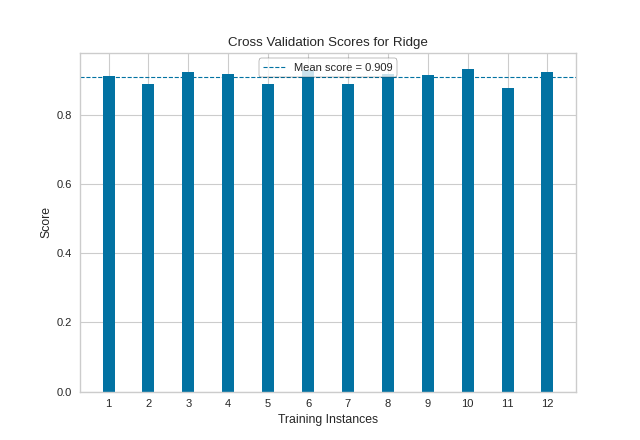
In this next example we show how to visualize cross-validated scores for a regression model. After loading our energy data as a DataFrame, we instantiated a simple KFold cross-validation strategy. We then fit the CVScores visualizer using the r2 scoring metric, to get a sense of the coefficient of determination for our regressor across all of our folds.
from sklearn.linear_model import Ridge
from sklearn.model_selection import KFold

from yellowbrick.datasets import load_energy
from yellowbrick.model_selection import CVScores

# Load the regression dataset
X, y = load_energy()

# Instantiate the regression model and visualizer
cv = KFold(n_splits=12, shuffle=True, random_state=42)

model = Ridge()
visualizer = CVScores(model, cv=cv, scoring='r2')

visualizer.fit(X, y)        # Fit the data to the visualizer
visualizer.show()           # Finalize and render the figure
(Source code, png, pdf)

As with our classification CVScores visualization, our regression visualization suggests that our Ridge regressor performs very well (e.g. produces a high coefficient of determination) across nearly every fold, resulting in another fairly high overall R2 score.
Quick Method
The same functionality above can be achieved with the associated quick method
cv_scores. This method will build theCVScoresobject with the associated arguments, fit it, then (optionally) immediately show the visualization.
from sklearn.linear_model import Ridge
from sklearn.model_selection import KFold

from yellowbrick.datasets import load_energy
from yellowbrick.model_selection import cv_scores

# Load the regression dataset
X, y = load_energy()

# Instantiate the regression model and visualizer
cv = KFold(n_splits=12, shuffle=True, random_state=42)

model = Ridge()
visualizer = cv_scores(model, X, y, cv=cv, scoring='r2')
(Source code, png, pdf)

API Reference
Implements cross-validation score plotting for model selection.
- class yellowbrick.model_selection.cross_validation.CVScores(estimator, ax=None, cv=None, scoring=None, color=None, **kwargs)[source]
Bases:
ModelVisualizerCVScores displays cross-validated scores as a bar chart, with the average of the scores plotted as a horizontal line.
- Parameters
- estimatora scikit-learn estimator
An object that implements
fitandpredict, can be a classifier, regressor, or clusterer so long as there is also a valid associated scoring metric. Note that the object is cloned for each validation.- axmatplotlib.Axes object, optional
The axes object to plot the figure on.
- cvint, cross-validation generator or an iterable, optional
Determines the cross-validation splitting strategy. Possible inputs for cv are:
None, to use the default 3-fold cross-validation,
integer, to specify the number of folds.
An object to be used as a cross-validation generator.
An iterable yielding train/test splits.
See the scikit-learn cross-validation guide for more information on the possible strategies that can be used here.
- scoringstring, callable or None, optional, default: None
A string or scorer callable object / function with signature
scorer(estimator, X, y).See scikit-learn cross-validation guide for more information on the possible metrics that can be used.
- color: string
Specify color for barchart
- kwargsdict
Keyword arguments that are passed to the base class and may influence the visualization as defined in other Visualizers.
- Attributes
- ——-
- cv_scores_ndarray shape (n_splits, )
The cross-validated scores from each subsection of the data
- cv_scores_mean_float
Average cross-validated score across all subsections of the data
Notes
This visualizer is a wrapper for sklearn.model_selection.cross_val_score.
Refer to the scikit-learn cross-validation guide for more details.
Examples
>>> from sklearn import datasets, svm
>>> iris = datasets.load_iris()
>>> clf = svm.SVC(kernel='linear', C=1)
>>> X = iris.data
>>> y = iris.target
>>> visualizer = CVScores(estimator=clf, cv=5, scoring='f1_macro')
>>> visualizer.fit(X,y)
>>> visualizer.show()
- draw(**kwargs)[source]
Creates the bar chart of the cross-validated scores generated from the fit method and places a dashed horizontal line that represents the average value of the scores.
- fit(X, y, **kwargs)[source]
Fits the learning curve with the wrapped model to the specified data. Draws training and test score curves and saves the scores to the estimator.
- Parameters
- Xarray-like, shape (n_samples, n_features)
Training vector, where n_samples is the number of samples and n_features is the number of features.
- yarray-like, shape (n_samples) or (n_samples, n_features), optional
Target relative to X for classification or regression; None for unsupervised learning.
- Returns
- selfinstance
- yellowbrick.model_selection.cross_validation.cv_scores(estimator, X, y, ax=None, cv=None, scoring=None, color=None, show=True, **kwargs)[source]
Displays cross validation scores as a bar chart and the average of the scores as a horizontal line
This helper function is a quick wrapper to utilize the CVScores visualizer for one-off analysis.
- Parameters
- estimatora scikit-learn estimator
An object that implements
fitandpredict, can be a classifier, regressor, or clusterer so long as there is also a valid associated scoring metric. Note that the object is cloned for each validation.- Xarray-like, shape (n_samples, n_features)
Training vector, where n_samples is the number of samples and n_features is the number of features.
- yarray-like, shape (n_samples) or (n_samples, n_features), optional
Target relative to X for classification or regression; None for unsupervised learning.
- axmatplotlib.Axes object, optional
The axes object to plot the figure on.
- cvint, cross-validation generator or an iterable, optional
Determines the cross-validation splitting strategy. Possible inputs for cv are:
None, to use the default 3-fold cross-validation,
integer, to specify the number of folds.
An object to be used as a cross-validation generator.
An iterable yielding train/test splits.
- see the scikit-learn
- `cross-validation guide <https://goo.gl/FS3VU6>`_
- for more information on the possible strategies that can be used here.
- scoringstring, callable or None, optional, default: None
A string or scorer callable object / function with signature
scorer(estimator, X, y).See scikit-learn cross-validation guide for more information on the possible metrics that can be used.
- color: string
Specify color for barchart
- show: bool, default: True
If True, calls
show(), which in turn callsplt.show()however you cannot callplt.savefigfrom this signature, norclear_figure. If False, simply callsfinalize()- kwargsdict
Keyword arguments that are passed to the base class and may influence the visualization as defined in other Visualizers.
- Returns
- visualizerCVScores
The fitted visualizer.