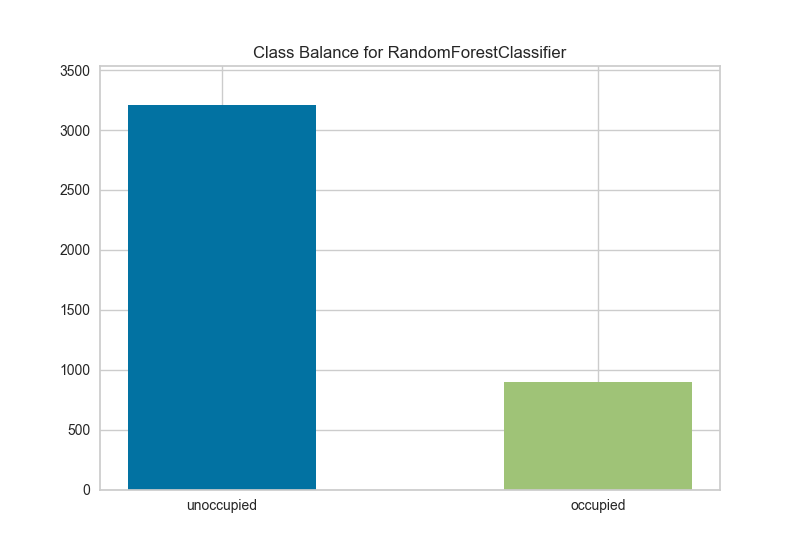
Class Balance
Oftentimes classifiers perform badly because of a class imbalance. A class balance chart can help prepare the user for such a case by showing the support for each class in the fitted classification model.
# Load the classification data set
data = load_data('occupancy')

# Specify the features of interest and the classes of the target
features = ["temperature", "relative humidity", "light", "C02", "humidity"]
classes = ['unoccupied', 'occupied']

# Extract the numpy arrays from the data frame
X = data[features].as_matrix()
y = data.occupancy.as_matrix()

# Create the train and test data
X_train, X_test, y_train, y_test = train_test_split(X, y, test_size=0.2)
# Instantiate the classification model and visualizer
forest = RandomForestClassifier()
visualizer = ClassBalance(forest, classes=classes)

visualizer.fit(X_train, y_train)  # Fit the training data to the visualizer
visualizer.score(X_test, y_test)  # Evaluate the model on the test data
g = visualizer.poof()             # Draw/show/poof the data
API Reference
Class balance visualizer for showing per-class support.
-
class
yellowbrick.classifier.class_balance.ClassBalance(model, ax=None, classes=None, **kwargs)[源代码]¶ 基类:
yellowbrick.classifier.base.ClassificationScoreVisualizerClass balance chart that shows the support for each class in the fitted classification model displayed as a bar plot. It is initialized with a fitted model and generates a class balance chart on draw.
Parameters: - ax: axes
the axis to plot the figure on.
- model: estimator
Scikit-Learn estimator object. Should be an instance of a classifier, else
__init__()will raise an exception.- classes: list
A list of class names for the legend. If classes is None and a y value is passed to fit then the classes are selected from the target vector.
- kwargs: dict
Keyword arguments passed to the super class. Here, used to colorize the bars in the histogram.
Notes
These parameters can be influenced later on in the visualization process, but can and should be set as early as possible.
-
draw()[源代码]¶ Renders the class balance chart across the axis.
Returns: - ax : the axis with the plotted figure
-
finalize(**kwargs)[源代码]¶ Finalize executes any subclass-specific axes finalization steps. The user calls poof and poof calls finalize.
Parameters: - kwargs: generic keyword arguments.
-
score(X, y=None, **kwargs)[源代码]¶ Generates the Scikit-Learn precision_recall_fscore_support
Parameters: - X : ndarray or DataFrame of shape n x m
A matrix of n instances with m features
- y : ndarray or Series of length n
An array or series of target or class values
Returns: - ax : the axis with the plotted figure