Confusion Matrix
The ConfusionMatrix visualizer is a ScoreVisualizer that takes a
fitted Scikit-Learn classifier and a set of test X and y values and
returns a report showing how each of the test values predicted classes
compare to their actual classes. Data scientists use confusion matrices
to understand which classes are most easily confused. These provide
similar information as what is available in a ClassificationReport, but
rather than top-level scores they provide deeper insight into the
classification of individual data points.
Below are a few examples of using the ConfusionMatrix visualizer; more information can be found by looking at the Scikit-Learn documentation on confusion matrices.
#First do our imports
import yellowbrick

from sklearn.datasets import load_digits
from sklearn.model_selection import train_test_split
from sklearn.linear_model import LogisticRegression

from yellowbrick.classifier import ConfusionMatrix
# We'll use the handwritten digits data set from scikit-learn.
# Each feature of this dataset is an 8x8 pixel image of a handwritten number.
# Digits.data converts these 64 pixels into a single array of features
digits = load_digits()
X = digits.data
y = digits.target

X_train, X_test, y_train, y_test = train_test_split(X,y, test_size =0.2, random_state=11)

model = LogisticRegression()

#The ConfusionMatrix visualizer taxes a model
cm = ConfusionMatrix(model, classes=[0,1,2,3,4,5,6,7,8,9])

#Fit fits the passed model. This is unnecessary if you pass the visualizer a pre-fitted model
cm.fit(X_train, y_train)

#To create the ConfusionMatrix, we need some test data. Score runs predict() on the data
#and then creates the confusion_matrix from scikit learn.
cm.score(X_test, y_test)

#How did we do?
cm.poof()
API Reference
Visual confusion matrix for classifier scoring.
-
class
yellowbrick.classifier.confusion_matrix.ConfusionMatrix(model, ax=None, classes=None, label_encoder=None, **kwargs)[源代码]¶ 基类:
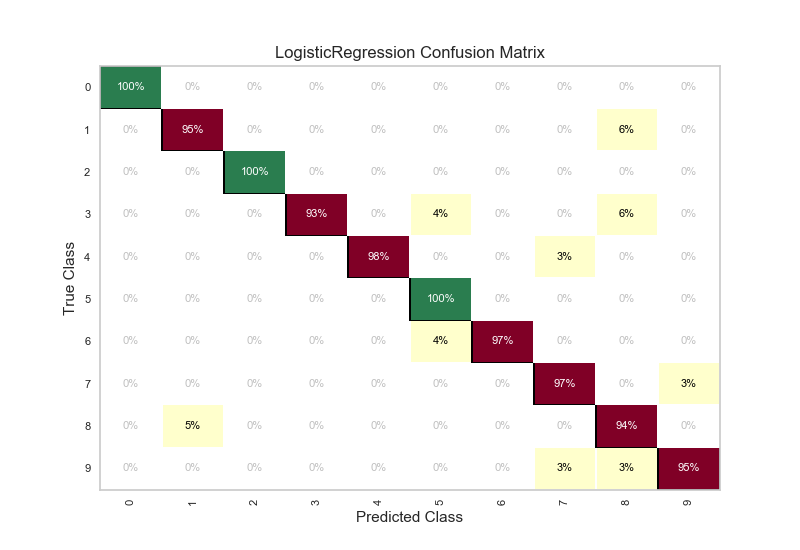
yellowbrick.classifier.base.ClassificationScoreVisualizerCreates a heatmap visualization of the sklearn.metrics.confusion_matrix(). A confusion matrix shows each combination of the true and predicted classes for a test data set.
The default color map uses a yellow/orange/red color scale. The user can choose between displaying values as the percent of true (cell value divided by sum of row) or as direct counts. If percent of true mode is selected, 100% accurate predictions are highlighted in green.
Requires a classification model
Parameters: - model : the Scikit-Learn estimator
Should be an instance of a classifier or __init__ will return an error.
- ax : the matplotlib axis to plot the figure on (if None, a new axis will be created)
- classes : list, default: None
a list of class names to use in the confusion_matrix. This is passed to the 'labels' parameter of sklearn.metrics.confusion_matrix(), and follows the behaviour indicated by that function. It may be used to reorder or select a subset of labels. If None, values that appear at least once in y_true or y_pred are used in sorted order.
- label_encoder : dict or LabelEncoder, default: None
When specifying the
classesargument, the input tofit()andscore()must match the expected labels. If theXandydatasets have been encoded prior to training and the labels must be preserved for the visualization, use this argument to provide a mapping from the encoded class to the correct label. Because typically a Scikit-LearnLabelEncoderis used to perform this operation, you may provide it directly to the class to utilize its fitted encoding.
Examples
>>> from yellowbrick.classifier import ConfusionMatrix
>>> from sklearn.linear_model import LogisticRegression
>>> viz = ConfusionMatrix(LogisticRegression())
>>> viz.fit(X_train, y_train)
>>> viz.score(X_test, y_test)
>>> viz.poof()
-
draw(percent=True)[源代码]¶ Renders the classification report Should only be called internally, as it uses values calculated in Score and score calls this method.
Parameters: - percent: Boolean
Whether the heatmap should represent "% of True" or raw counts
-
finalize(**kwargs)[源代码]¶ Finalize executes any subclass-specific axes finalization steps.
Parameters: - kwargs: dict
generic keyword arguments.
Notes
The user calls poof and poof calls finalize. Developers should implement visualizer-specific finalization methods like setting titles or axes labels, etc.
-
score(X, y, sample_weight=None, percent=True)[源代码]¶ Generates the Scikit-Learn confusion_matrix and applies this to the appropriate axis
Parameters: - X : ndarray or DataFrame of shape n x m
A matrix of n instances with m features
- y : ndarray or Series of length n
An array or series of target or class values
- sample_weight: optional, passed to the confusion_matrix
- percent: optional, Boolean. Determines whether or not the confusion_matrix
should be displayed as raw numbers or as a percent of the true predictions. Note, if using a subset of classes in __init__, percent should be set to False or inaccurate percents will be displayed.