Rank Features
Rank1D and Rank2D evaluate single features or pairs of features using a variety of metrics that score the features on the scale [-1, 1] or [0, 1] allowing them to be ranked. A similar concept to SPLOMs, the scores are visualized on a lower-left triangle heatmap so that patterns between pairs of features can be easily discerned for downstream analysis.
In this example, we'll use the credit default data set from the UCI Machine Learning repository to rank features. The code below creates our instance matrix and target vector.
# Load the dataset
data = load_data('credit')

# Specify the features of interest
features = [
        'limit', 'sex', 'edu', 'married', 'age', 'apr_delay', 'may_delay',
        'jun_delay', 'jul_delay', 'aug_delay', 'sep_delay', 'apr_bill', 'may_bill',
        'jun_bill', 'jul_bill', 'aug_bill', 'sep_bill', 'apr_pay', 'may_pay', 'jun_pay',
        'jul_pay', 'aug_pay', 'sep_pay',
    ]

# Extract the numpy arrays from the data frame
X = data[features].as_matrix()
y = data.default.as_matrix()
Rank 1D
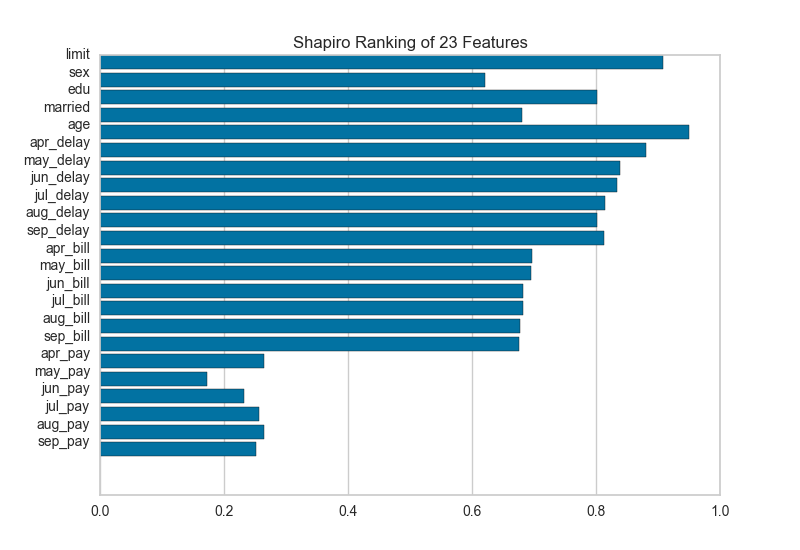
A one dimensional ranking of features utilizes a ranking algorithm that takes into account only a single feature at a time (e.g. histogram analysis). By default we utilize the Shapiro-Wilk algorithm to assess the normality of the distribution of instances with respect to the feature. A barplot is then drawn showing the relative ranks of each feature.
# Instantiate the 1D visualizer with the Sharpiro ranking algorithm
visualizer = Rank1D(features=features, algorithm='shapiro')

visualizer.fit(X, y)                # Fit the data to the visualizer
visualizer.transform(X)             # Transform the data
visualizer.poof()                   # Draw/show/poof the data
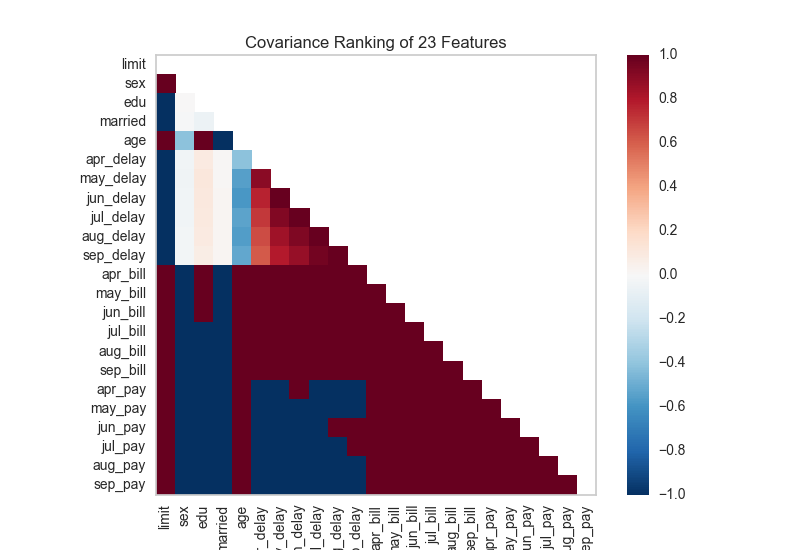
Rank 2D
A two dimensional ranking of features utilizes a ranking algorithm that takes into account pairs of features at a time (e.g. joint plot analysis). The pairs of features are then ranked by score and visualized using the lower left triangle of a feature co-occurence matrix.
The default ranking algorithm is covariance, which attempts to compute the mean value of the product of deviations of variates from their respective means. Covariance loosely attempts to detect a colinear relationship between features.
# Instantiate the visualizer with the Covariance ranking algorithm
visualizer = Rank2D(features=features, algorithm='covariance')

visualizer.fit(X, y)                # Fit the data to the visualizer
visualizer.transform(X)             # Transform the data
visualizer.poof()                   # Draw/show/poof the data
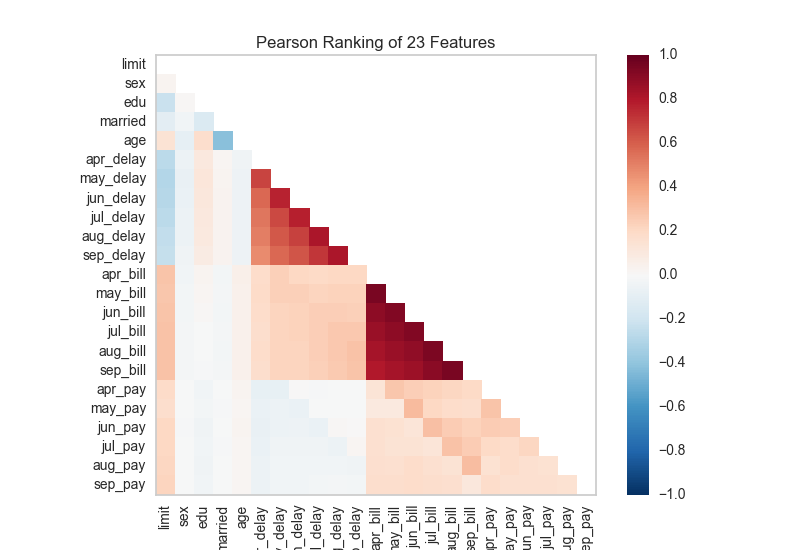
Alternatively we can utilize a linear correlation algorithm such as a Pearson score to similarly detect colinear relationships. Compare the output from Pearson below to the covariance ranking above.
# Instantiate the visualizer with the Pearson ranking algorithm
visualizer = Rank2D(features=features, algorithm='pearson')

visualizer.fit(X, y)                # Fit the data to the visualizer
visualizer.transform(X)             # Transform the data
visualizer.poof()                   # Draw/show/poof the data
API Reference
Implements 1D (histograms) and 2D (joint plot) feature rankings.
-
class
yellowbrick.features.rankd.Rank1D(ax=None, algorithm='shapiro', features=None, orient='h', show_feature_names=True, **kwargs)[源代码]¶ 基类:
yellowbrick.features.rankd.RankDBaseRank1D computes a score for each feature in the data set with a specific metric or algorithm (e.g. Shapiro-Wilk) then returns the features ranked as a bar plot.
Parameters: - ax : matplotlib Axes, default: None
The axis to plot the figure on. If None is passed in the current axes will be used (or generated if required).
- algorithm : one of {'shapiro', }, default: 'shapiro'
The ranking algorithm to use, default is 'Shapiro-Wilk.
- features : list
A list of feature names to use. If a DataFrame is passed to fit and features is None, feature names are selected as the columns of the DataFrame.
- orient : 'h' or 'v'
Specifies a horizontal or vertical bar chart.
- show_feature_names : boolean, default: True
If True, the feature names are used to label the x and y ticks in the plot.
- kwargs : dict
Keyword arguments that are passed to the base class and may influence the visualization as defined in other Visualizers.
Examples
>>> visualizer = Rank1D()
>>> visualizer.fit(X, y)
>>> visualizer.transform(X)
>>> visualizer.poof()
Attributes: - ranks_ : ndarray
An array of rank scores with shape (n,), where n is the number of features. It is computed during fit.
-
ranking_methods= {'shapiro': <function Rank1D.<lambda>>}
-
class
yellowbrick.features.rankd.Rank2D(ax=None, algorithm='pearson', features=None, colormap='RdBu_r', show_feature_names=True, **kwargs)[源代码]¶ 基类:
yellowbrick.features.rankd.RankDBaseRank2D performs pairwise comparisons of each feature in the data set with a specific metric or algorithm (e.g. Pearson correlation) then returns them ranked as a lower left triangle diagram.
Parameters: - ax : matplotlib Axes, default: None
The axis to plot the figure on. If None is passed in the current axes will be used (or generated if required).
- algorithm : one of {'pearson', 'covariance'}, default: 'pearson'
The ranking algorithm to use, default is Pearson correlation.
- features : list
A list of feature names to use. If a DataFrame is passed to fit and features is None, feature names are selected as the columns of the DataFrame.
- colormap : string or cmap, default: 'RdBu_r'
optional string or matplotlib cmap to colorize lines Use either color to colorize the lines on a per class basis or colormap to color them on a continuous scale.
- show_feature_names : boolean, default: True
If True, the feature names are used to label the axis ticks in the plot.
- kwargs : dict
Keyword arguments that are passed to the base class and may influence the visualization as defined in other Visualizers.
Notes
These parameters can be influenced later on in the visualization process, but can and should be set as early as possible.
Examples
>>> visualizer = Rank2D()
>>> visualizer.fit(X, y)
>>> visualizer.transform(X)
>>> visualizer.poof()
Attributes: - ranks_ : ndarray
An array of rank scores with shape (n,n), where n is the number of features. It is computed during fit.
-
ranking_methods= {'covariance': <function Rank2D.<lambda>>, 'pearson': <function Rank2D.<lambda>>}