DecisionBoundaries Vizualizer
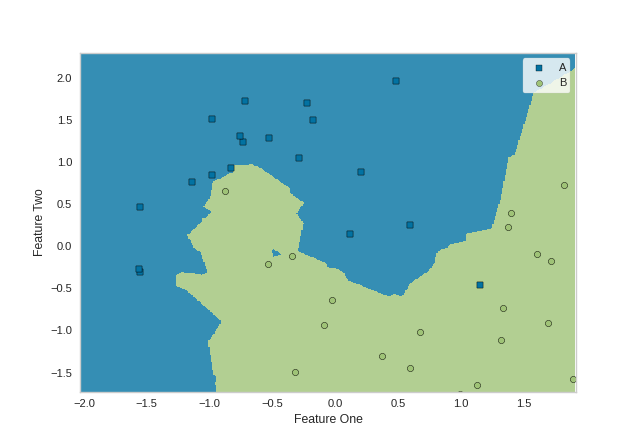
The DecisionBoundariesVisualizer is a bivariate data visualization algorithm that plots the decision boundaries of each class.
from sklearn.model_selection import train_test_split as tts
from sklearn.preprocessing import StandardScaler
from sklearn.datasets import make_moons
from sklearn.neighbors import KNeighborsClassifier
from yellowbrick.contrib.classifier import DecisionViz

data_set = make_moons(noise=0.3, random_state=0)

X, y = data_set
X = StandardScaler().fit_transform(X)
X_train, X_test, y_train, y_test = tts(X, y, test_size=.4, random_state=42)

viz = DecisionViz(
    KNeighborsClassifier(3), title="Nearest Neighbors",
    features=['Feature One', 'Feature Two'], classes=['A', 'B']
)
viz.fit(X_train, y_train)
viz.draw(X_test, y_test)
viz.show()
(Source code, png, pdf)

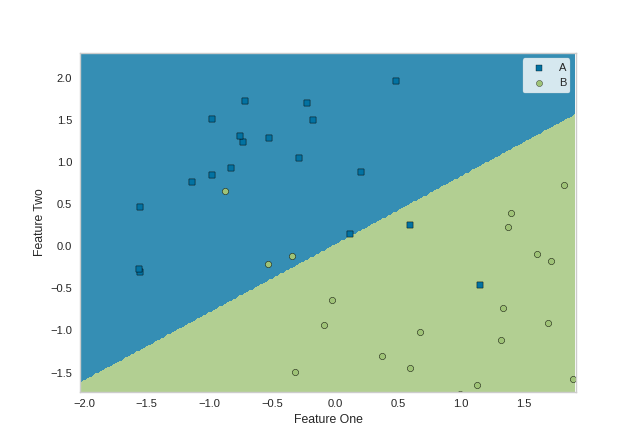
from sklearn.svm import SVC
from sklearn.model_selection import train_test_split as tts
from sklearn.preprocessing import StandardScaler
from sklearn.datasets import make_moons
from sklearn.neighbors import KNeighborsClassifier
from yellowbrick.contrib.classifier import DecisionViz

data_set = make_moons(noise=0.3, random_state=0)

X, y = data_set
X = StandardScaler().fit_transform(X)
X_train, X_test, y_train, y_test = tts(X, y, test_size=.4, random_state=42)


viz = DecisionViz(
    SVC(kernel="linear", C=0.025), title="Linear SVM",
    features=['Feature One', 'Feature Two'], classes=['A', 'B']
)
viz.fit(X_train, y_train)
viz.draw(X_test, y_test)
viz.show()
(Source code, png, pdf)
API Reference
- class yellowbrick.contrib.classifier.boundaries.DecisionBoundariesVisualizer(estimator, ax=None, x=None, y=None, features=None, classes=None, show_scatter=True, step_size=0.0025, markers=None, pcolormesh_alpha=0.8, scatter_alpha=1.0, encoder=None, is_fitted='auto', force_model=False, **kwargs)[source]
Bases:
ClassificationScoreVisualizerDecisionBoundariesVisualizer is a bivariate data visualization algorithm that plots the decision boundaries of each class.
- Parameters
- estimatorestimator
A scikit-learn estimator that should be a classifier. If the model is not a classifier, an exception is raised. If the internal model is not fitted, it is fit when the visualizer is fitted, unless otherwise specified by
is_fitted.- axmatplotlib Axes, default: None
The axes to plot the figure on. If not specified the current axes will be used (or generated if required).
- xstring, default: None
The feature name that corresponds to a column name or index postion in the matrix that will be plotted against the x-axis
- ystring, default: None
The feature name that corresponds to a column name or index postion in the matrix that will be plotted against the y-axis
- featureslist of strings, default: None
The names of the features or columns
- classeslist of str, defult: None
The class labels to use for the legend ordered by the index of the sorted classes discovered in the
fit()method. Specifying classes in this manner is used to change the class names to a more specific format or to label encoded integer classes. Some visualizers may also use this field to filter the visualization for specific classes. For more advanced usage specify an encoder rather than class labels.- show_scatterboolean, default: True
If boolean is True, then a scatter plot with points will be drawn on top of the decision boundary graph
- step_sizefloat percentage, default: 0.0025
Determines the step size for creating the numpy meshgrid that will later become the foundation of the decision boundary graph. The default value of 0.0025 means that the step size for constructing the meshgrid will be 0.25%% of differenes of the max and min of x and y for each feature.
- markersiterable of strings, default: ,od*vh+
Matplotlib style markers for points on the scatter plot points
- pcolormesh_alphafloat, default: 0.8
Sets the alpha transparency for the meshgrid of model boundaries
- scatter_alphafloat, default: 1.0
Sets the alpha transparency for the scatter plot points
- encoderdict or LabelEncoder, default: None
A mapping of classes to human readable labels. Often there is a mismatch between desired class labels and those contained in the target variable passed to
fit()orscore(). The encoder disambiguates this mismatch ensuring that classes are labeled correctly in the visualization.- is_fittedbool or str, default=”auto”
Specify if the wrapped estimator is already fitted. If False, the estimator will be fit when the visualizer is fit, otherwise, the estimator will not be modified. If “auto” (default), a helper method will check if the estimator is fitted before fitting it again.
- force_modelbool, default: False
Do not check to ensure that the underlying estimator is a classifier. This will prevent an exception when the visualizer is initialized but may result in unexpected or unintended behavior.
- kwargsdict
Keyword arguments passed to the visualizer base classes.
- draw(X, y=None, **kwargs)[source]
Called from the fit method, this method creates a decision boundary plot, and if self.scatter is True, it will scatter plot that draws each instance as a class or target colored point, whose location is determined by the feature data set.
- finalize(**kwargs)[source]
Sets the title and axis labels and adds a legend.
- Parameters
- kwargs: generic keyword arguments.
Notes
Generally this method is called from show and not directly by the user.
- fit(X, y=None, **kwargs)[source]
The fit method is the primary drawing input for the decision boundaries visualization since it has both the X and y data required for the viz and the transform method does not.
- Parameters
- Xndarray or DataFrame of shape n x m
A matrix of n instances with m features
- yndarray or Series of length n
An array or series of target or class values
- kwargsdict
Pass generic arguments to the drawing method
- Returns
- selfinstance
Returns the instance of the visualizer