Recursive Feature Elimination
Recursive feature elimination (RFE) is a feature selection method that fits a model and removes the weakest feature (or features) until the specified number of features is reached. Features are ranked by the model’s coef_ or feature_importances_ attributes, and by recursively eliminating a small number of features per loop, RFE attempts to eliminate dependencies and collinearity that may exist in the model.
RFE requires a specified number of features to keep, however it is often not known in advance how many features are valid. To find the optimal number of features cross-validation is used with RFE to score different feature subsets and select the best scoring collection of features. The RFECV visualizer plots the number of features in the model along with their cross-validated test score and variability and visualizes the selected number of features.
To show how this works in practice, we’ll start with a contrived example using a dataset that has only 3 informative features out of 25.
from sklearn.svm import SVC
from sklearn.datasets import make_classification

from yellowbrick.model_selection import RFECV

# Create a dataset with only 3 informative features
X, y = make_classification(
    n_samples=1000, n_features=25, n_informative=3, n_redundant=2,
    n_repeated=0, n_classes=8, n_clusters_per_class=1, random_state=0
)

# Instantiate RFECV visualizer with a linear SVM classifier
visualizer = RFECV(SVC(kernel='linear', C=1))

visualizer.fit(X, y)        # Fit the data to the visualizer
visualizer.show()           # Finalize and render the figure
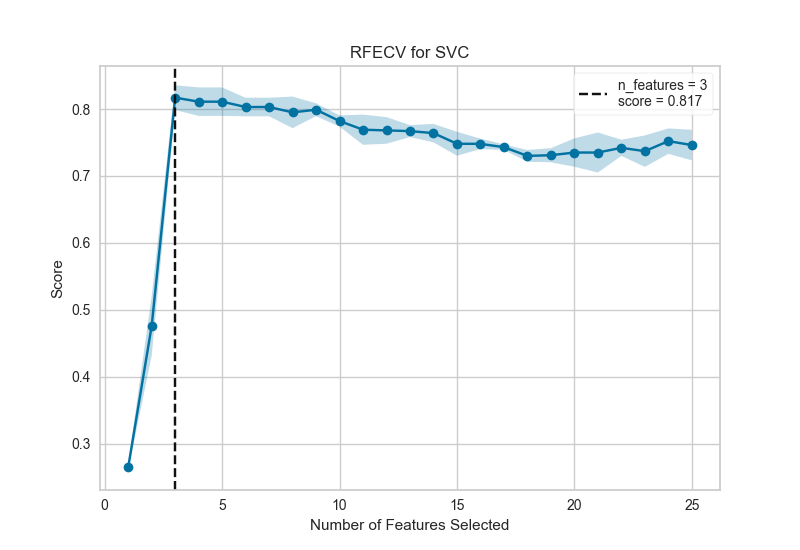
This figure shows an ideal RFECV curve, the curve jumps to an excellent accuracy when the three informative features are captured, then gradually decreases in accuracy as the non informative features are added into the model. The shaded area represents the variability of cross-validation, one standard deviation above and below the mean accuracy score drawn by the curve.
Exploring a real dataset, we can see the impact of RFECV on a credit default binary classifier.
from sklearn.ensemble import RandomForestClassifier
from sklearn.model_selection import StratifiedKFold

from yellowbrick.model_selection import RFECV
from yellowbrick.datasets import load_credit

# Load classification dataset
X, y = load_credit()

cv = StratifiedKFold(5)
visualizer = RFECV(RandomForestClassifier(), cv=cv, scoring='f1_weighted')

visualizer.fit(X, y)        # Fit the data to the visualizer
visualizer.show()           # Finalize and render the figure
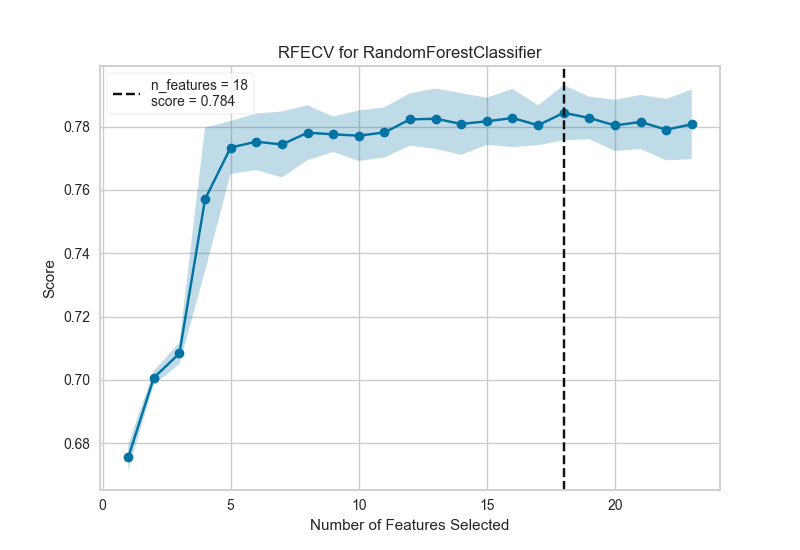
In this example we can see that 19 features were selected, though there doesn’t appear to be much improvement in the f1 score of the model after around 5 features. Selection of the features to eliminate plays a large role in determining the outcome of each recursion; modifying the step parameter to eliminate more than one feature at each step may help to eliminate the worst features early, strengthening the remaining features (and can also be used to speed up feature elimination for datasets with a large number of features).
See also
This visualizer is is based off of the visualization in the scikit-learn documentation: recursive feature elimination with cross-validation. However, the Yellowbrick version does not use sklearn.feature_selection.RFECV but instead wraps sklearn.feature_selection.RFE models. The fitted model can be accessed on the visualizer using the viz.rfe_estimator_ attribute, and in fact the visualizer acts as the fitted model when using predict() or score().
Quick Method
The same functionality above can be achieved with the associated quick method rfecv. This method will build the RFECV object with the associated arguments, fit it, then (optionally) immediately show the visualization.
from sklearn.ensemble import RandomForestClassifier
from sklearn.model_selection import StratifiedKFold
from yellowbrick.model_selection import rfecv
from yellowbrick.datasets import load_credit
# Load classification dataset
X, y = load_credit()
cv = StratifiedKFold(5)
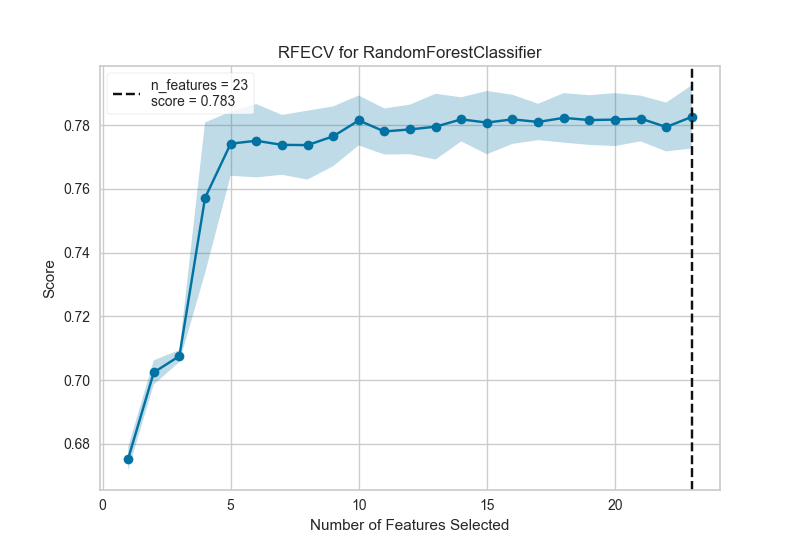
visualizer = rfecv(RandomForestClassifier(), X=X, y=y, cv=cv, scoring='f1_weighted')
API Reference
Visualize the number of features selected using recursive feature elimination
- class yellowbrick.model_selection.rfecv.RFECV(estimator, ax=None, step=1, groups=None, cv=None, scoring=None, **kwargs)[source]
Bases:
ModelVisualizerRecursive Feature Elimination, Cross-Validated (RFECV) feature selection.
Selects the best subset of features for the supplied estimator by removing 0 to N features (where N is the number of features) using recursive feature elimination, then selecting the best subset based on the cross-validation score of the model. Recursive feature elimination eliminates n features from a model by fitting the model multiple times and at each step, removing the weakest features, determined by either the
coef_orfeature_importances_attribute of the fitted model.The visualization plots the score relative to each subset and shows trends in feature elimination. If the feature elimination CV score is flat, then potentially there are not enough features in the model. An ideal curve is when the score jumps from low to high as the number of features removed increases, then slowly decreases again from the optimal number of features.
- Parameters
- estimatora scikit-learn estimator
An object that implements
fitand provides information about the relative importance of features with either acoef_orfeature_importances_attribute.Note that the object is cloned for each validation.
- axmatplotlib.Axes object, optional
The axes object to plot the figure on.
- stepint or float, optional (default=1)
If greater than or equal to 1, then step corresponds to the (integer) number of features to remove at each iteration. If within (0.0, 1.0), then step corresponds to the percentage (rounded down) of features to remove at each iteration.
- groupsarray-like, with shape (n_samples,), optional
Group labels for the samples used while splitting the dataset into train/test set.
- cvint, cross-validation generator or an iterable, optional
Determines the cross-validation splitting strategy. Possible inputs for cv are:
None, to use the default 3-fold cross-validation,
integer, to specify the number of folds.
An object to be used as a cross-validation generator.
An iterable yielding train/test splits.
see the scikit-learn cross-validation guide for more information on the possible strategies that can be used here.
- scoringstring, callable or None, optional, default: None
A string or scorer callable object / function with signature
scorer(estimator, X, y). See scikit-learn model evaluation documentation for names of possible metrics.- kwargsdict
Keyword arguments that are passed to the base class and may influence the visualization as defined in other Visualizers.
Notes
This model wraps
sklearn.feature_selection.RFEand notsklearn.feature_selection.RFECVbecause access to the internals of the CV and RFE estimators is required for the visualization. The visualizer does take similar arguments, however it does not expose the same internal attributes.Additionally, the RFE model can be accessed via the
rfe_estimator_attribute. Once fitted, the visualizer acts as a wrapper for this estimator and not for the original model passed to the model. This way the visualizer model can be used to make predictions.Caution
This visualizer requires a model that has either a
coef_orfeature_importances_attribute when fitted.- Attributes
- n_features_int
The number of features in the selected subset
- support_array of shape [n_features]
A mask of the selected features
- ranking_array of shape [n_features]
The feature ranking, such that
ranking_[i]corresponds to the ranked position of feature i. Selected features are assigned rank 1.- cv_scores_array of shape [n_subsets_of_features, n_splits]
The cross-validation scores for each subset of features and splits in the cross-validation strategy.
- rfe_estimator_sklearn.feature_selection.RFE
A fitted RFE estimator wrapping the original estimator. All estimator functions such as
predict()andscore()are passed through to this estimator (it rewraps the original model).- n_feature_subsets_array of shape [n_subsets_of_features]
The number of features removed on each iteration of RFE, computed by the number of features in the dataset and the step parameter.
- fit(X, y=None)[source]
Fits the RFECV with the wrapped model to the specified data and draws the rfecv curve with the optimal number of features found.
- Parameters
- Xarray-like, shape (n_samples, n_features)
Training vector, where n_samples is the number of samples and n_features is the number of features.
- yarray-like, shape (n_samples) or (n_samples, n_features), optional
Target relative to X for classification or regression.
- Returns
- selfinstance
Returns the instance of the RFECV visualizer.
- yellowbrick.model_selection.rfecv.rfecv(estimator, X, y, ax=None, step=1, groups=None, cv=None, scoring=None, show=True, **kwargs)[source]
Performs recursive feature elimination with cross-validation to determine an optimal number of features for a model. Visualizes the feature subsets with respect to the cross-validation score.
This helper function is a quick wrapper to utilize the RFECV visualizer for one-off analysis.
- Parameters
- estimatora scikit-learn estimator
An object that implements
fitand provides information about the relative importance of features with either acoef_orfeature_importances_attribute.Note that the object is cloned for each validation.
- Xarray-like, shape (n_samples, n_features)
Training vector, where n_samples is the number of samples and n_features is the number of features.
- yarray-like, shape (n_samples) or (n_samples, n_features), optional
Target relative to X for classification or regression.
- axmatplotlib.Axes object, optional
The axes object to plot the figure on.
- stepint or float, optional (default=1)
If greater than or equal to 1, then step corresponds to the (integer) number of features to remove at each iteration. If within (0.0, 1.0), then step corresponds to the percentage (rounded down) of features to remove at each iteration.
- groupsarray-like, with shape (n_samples,), optional
Group labels for the samples used while splitting the dataset into train/test set.
- cvint, cross-validation generator or an iterable, optional
Determines the cross-validation splitting strategy. Possible inputs for cv are:
None, to use the default 3-fold cross-validation,
integer, to specify the number of folds.
An object to be used as a cross-validation generator.
An iterable yielding train/test splits.
see the scikit-learn cross-validation guide for more information on the possible strategies that can be used here.
- scoringstring, callable or None, optional, default: None
A string or scorer callable object / function with signature
scorer(estimator, X, y). See scikit-learn model evaluation documentation for names of possible metrics.- show: bool, default: True
If True, calls
show(), which in turn callsplt.show()however you cannot callplt.savefigfrom this signature, norclear_figure. If False, simply callsfinalize()- kwargsdict
Keyword arguments that are passed to the base class and may influence the visualization as defined in other Visualizers. These arguments are also passed to the show() method, e.g. can pass a path to save the figure to.
- Returns
- vizRFECV
Returns the fitted, finalized visualizer.