Word Correlation Plot
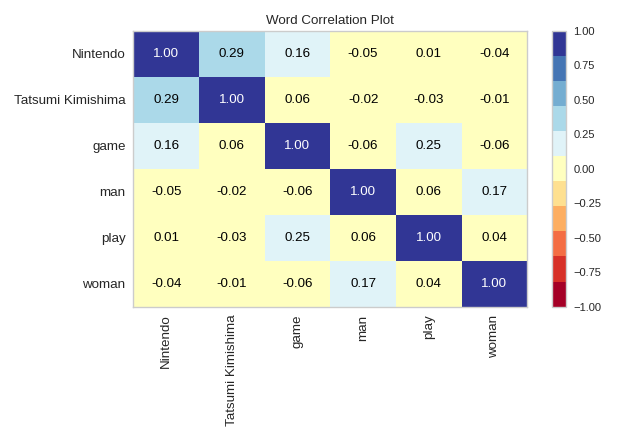
Word correlation illustrates the extent to which words or phrases co-appear across the documents in a corpus. This can be useful for understanding the relationships between known text features in a corpus with many documents. WordCorrelationPlot allows for the visualization of the document occurrence correlations between select words in a corpus. For a number of features n, the plot renders an n x n heatmap containing correlation values.
The correlation values are computed using the phi coefficient metric, which is a measure of the association between two binary variables. A value close to 1 or -1 indicates that the occurrences of the two features are highly positively or negatively correlated, while a value close to 0 indicates no relationship between the two features.
Visualizer |
|
Quick Method |
|
Models |
Text Modeling |
Workflow |
Feature Engineering |
from yellowbrick.datasets import load_hobbies
from yellowbrick.text.correlation import WordCorrelationPlot

# Load the text corpus
corpus = load_hobbies()

# Create the list of words to plot
words = ["Tatsumi Kimishima", "Nintendo", "game", "play", "man", "woman"]

# Instantiate the visualizer and draw the plot
viz = WordCorrelationPlot(words)
viz.fit(corpus.data)
viz.show()
(Source code, png, pdf)
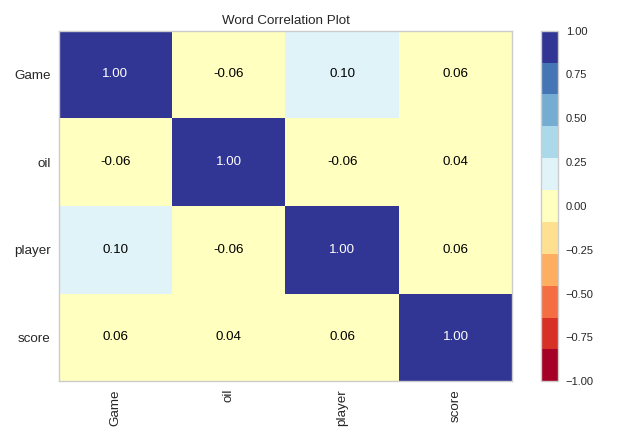
Quick Method
The same functionality above can be achieved with the associated quick method word_correlation. This method will build the Word Correlation Plot object with the associated arguments, fit it, then (optionally) immediately show the visualization.
from yellowbrick.datasets import load_hobbies
from yellowbrick.text.correlation import word_correlation

# Load the text corpus
corpus = load_hobbies()

# Create the list of words to plot
words = ["Game", "player", "score", "oil"]

# Draw the plot
word_correlation(words, corpus.data)
(Source code, png, pdf)

API Reference
Implementation of word correlation for text visualization.
- class yellowbrick.text.correlation.WordCorrelationPlot(words, ignore_case=False, ax=None, cmap='RdYlBu', colorbar=True, fontsize=None, **kwargs)[source]
Bases:
TextVisualizerWord correlation illustrates the extent to which words in a corpus appear in the same documents.
WordCorrelationPlot visualizes the binary correlation between words across documents as a heatmap. The correlation is defined using the mean square contingency coefficient (phi-coefficient) between any two words m and n. The coefficient is a value between -1 and 1, inclusive. A value close to 1 or -1 indicates strong positive or negative correlation between m and n, while a value close to 0 indicates little or no correlation. The constructor takes one required argument, which is the list of words or n-grams to be plotted.
- Parameters
- wordslist of str
The list of words or n-grams to be plotted. The words must be present in the provided corpus on fit().
- ignore_casebool, default: False
If True, all words will be converted to lowercase before processing.
- axmatplotlib Axes, default: None
The axes to plot the figure on.
- cmapstr or cmap, default: “RdYlBu”
Colormap to use for the heatmap.
- colorbarbool, default: True
If True, a colorbar will be added to the heatmap.
- fontsizeint, default: None
Font size to use for the labels on the axes.
- kwargsdict
Pass any additional keyword arguments to the super class.
- Attributes
- self.doc_term_matrix_array of shape (n_docs, n_features)
The computed sparse document-term matrix containing binary values indicating if a word is present in a document.
- self.num_docs_int
The number of observed documents in the corpus.
- self.vocab_dict
A dictionary mapping words to their indices in the document-term matrix.
- self.num_features_int
The number of features (word labels) in the resulting plot.
- self.correlation_matrix_ndarray of shape (n_features, n_features)
The computed matrix containing the phi-coefficients between all features.
- draw(X)[source]
Called from the fit() method, this metod draws the heatmap on the figure using the computed correlation matrix.
- finalize()[source]
Prepares the figure for rendering by adding the title. This method is usually called from show() and not directly by the user.
- fit(X, y=None)[source]
The fit method is the primary drawing input for the word correlation visualization.
- Parameters
- Xlist of str or generator
Should be provided as a list of strings or a generator yielding strings that represent the documents in the corpus.
- yNone
Labels are not used for the word correlation visualization.
- Returns
- self: instance
Returns the instance of the transformer/visualizer.
- Attributes
- self.doc_term_matrix_array of shape (n_docs, n_features)
The computed sparse document-term matrix containing binary values indicating if a word is present in a document.
- self.num_docs_int
The number of observed documents in the corpus.
- self.vocab_dict
A dictionary mapping words to their indices in the document-term matrix.
- self.num_features_int
The number of features (word labels) in the resulting plot.
- self.correlation_matrix_ndarray of shape (n_features, n_features)
The computed matrix containing the phi-coefficients between all features.
- yellowbrick.text.correlation.word_correlation(words, corpus, ignore_case=True, ax=None, cmap='RdYlBu', show=True, colorbar=True, fontsize=None, **kwargs)[source]
Word Correlation
Displays the binary correlation between the given words across the documents in a corpus. For a list of words with length n, this produces an n x n heatmap of correlation values in the range [-1, 1].
- Parameters
- wordslist of str
The corpus words to display in the heatmap.
- corpuslist of str or generator
The corpus as a list of documents or a generator yielding documents.
- ignore_casebool, default: True
If True, all words will be converted to lowercase before proessing.
- axmatplotlib axes, default: None
The axes to plot the figure on.
- cmapstr, default: “RdYlBu”
Colormap to use for the heatmap.
- showbool, default: True
If True, calls
show(), which in turn callsplt.show()however you cannot callplt.savefigfrom this signature, norclear_figure. If False, simply callsfinalize()- colorbarbool, default: True
If True, adds a colorbar to the figure.
- fontsizeint, default: None
If not None, sets the font size of the labels.