Confusion Matrix
The ConfusionMatrix visualizer is a ScoreVisualizer that takes a
fitted scikit-learn classifier and a set of test X and y values and
returns a report showing how each of the test values predicted classes
compare to their actual classes. Data scientists use confusion matrices
to understand which classes are most easily confused. These provide
similar information as what is available in a ClassificationReport, but
rather than top-level scores, they provide deeper insight into the
classification of individual data points.
Below are a few examples of using the ConfusionMatrix visualizer; more
information can be found by looking at the
scikit-learn documentation on confusion matrices.
Visualizer |
|
Quick Method |
|
Models |
Classification |
Workflow |
Model evaluation |
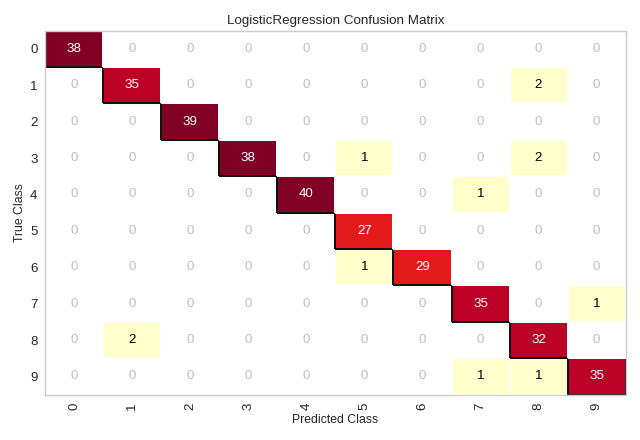
from sklearn.datasets import load_digits
from sklearn.model_selection import train_test_split as tts
from sklearn.linear_model import LogisticRegression
from yellowbrick.classifier import ConfusionMatrix

# We'll use the handwritten digits data set from scikit-learn.
# Each feature of this dataset is an 8x8 pixel image of a handwritten number.
# Digits.data converts these 64 pixels into a single array of features
digits = load_digits()
X = digits.data
y = digits.target

X_train, X_test, y_train, y_test = tts(X, y, test_size =0.2, random_state=11)

model = LogisticRegression(multi_class="auto", solver="liblinear")

# The ConfusionMatrix visualizer taxes a model
cm = ConfusionMatrix(model, classes=[0,1,2,3,4,5,6,7,8,9])

# Fit fits the passed model. This is unnecessary if you pass the visualizer a pre-fitted model
cm.fit(X_train, y_train)

# To create the ConfusionMatrix, we need some test data. Score runs predict() on the data
# and then creates the confusion_matrix from scikit-learn.
cm.score(X_test, y_test)

# How did we do?
cm.show()
(Source code, png, pdf)

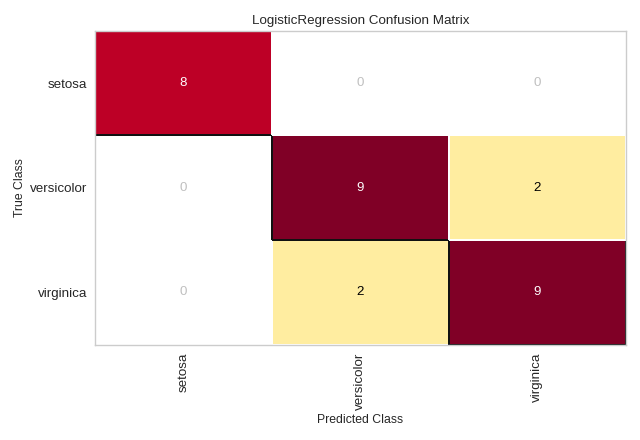
Plotting with Class Names
Class names can be added to a ConfusionMatrix plot using the label_encoder argument. The label_encoder can be a sklearn.preprocessing.LabelEncoder (or anything with an inverse_transform method that performs the mapping), or a dict with the encoding-to-string mapping as in the example below:
from sklearn.datasets import load_iris
from sklearn.linear_model import LogisticRegression
from sklearn.model_selection import train_test_split as tts

from yellowbrick.classifier import ConfusionMatrix

iris = load_iris()
X = iris.data
y = iris.target
classes = iris.target_names

X_train, X_test, y_train, y_test = tts(X, y, test_size=0.2)

model = LogisticRegression(multi_class="auto", solver="liblinear")

iris_cm = ConfusionMatrix(
    model, classes=classes,
    label_encoder={0: 'setosa', 1: 'versicolor', 2: 'virginica'}
)

iris_cm.fit(X_train, y_train)
iris_cm.score(X_test, y_test)
iris_cm.show()
(Source code, png, pdf)
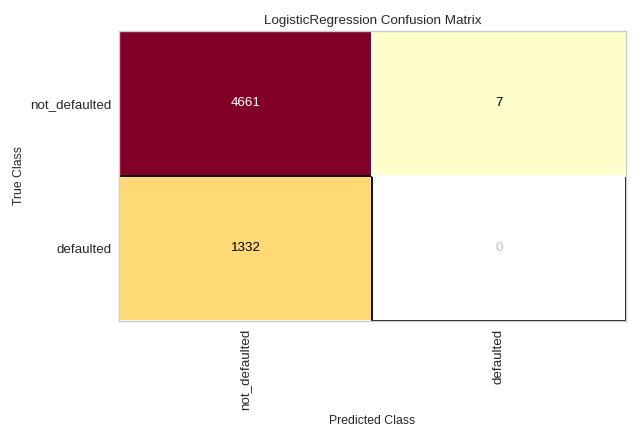
Quick Method
The same functionality above can be achieved with the associated quick method confusion_matrix. This method will build the ConfusionMatrix object with the associated arguments, fit it, then (optionally) immediately show it. In the below example we can see how a LogisticRegression struggles to effectively model the credit dataset (hint: check out Rank2D to examine for multicollinearity!).
from yellowbrick.datasets import load_credit
from yellowbrick.classifier import confusion_matrix
from sklearn.linear_model import LogisticRegression
from sklearn.model_selection import train_test_split as tts

#Load the classification dataset
X, y = load_credit()

#Create the train and test data
X_train, X_test, y_train, y_test = tts(X, y, test_size=0.2)

# Instantiate the visualizer with the classification model
confusion_matrix(
    LogisticRegression(),
    X_train, y_train, X_test, y_test,
    classes=['not_defaulted', 'defaulted']
)
plt.tight_layout()
(Source code, png, pdf)

API Reference
Visual confusion matrix for classifier scoring.
- class yellowbrick.classifier.confusion_matrix.ConfusionMatrix(estimator, ax=None, sample_weight=None, percent=False, classes=None, encoder=None, cmap='YlOrRd', fontsize=None, is_fitted='auto', force_model=False, **kwargs)[source]
Bases:
ClassificationScoreVisualizerCreates a heatmap visualization of the sklearn.metrics.confusion_matrix(). A confusion matrix shows each combination of the true and predicted classes for a test data set.
The default color map uses a yellow/orange/red color scale. The user can choose between displaying values as the percent of true (cell value divided by sum of row) or as direct counts. If percent of true mode is selected, 100% accurate predictions are highlighted in green.
Requires a classification model.
- Parameters
- estimatorestimator
A scikit-learn estimator that should be a classifier. If the model is not a classifier, an exception is raised. If the internal model is not fitted, it is fit when the visualizer is fitted, unless otherwise specified by
is_fitted.- axmatplotlib Axes, default: None
The axes to plot the figure on. If not specified the current axes will be used (or generated if required).
- sample_weight: array-like of shape = [n_samples], optional
Passed to
confusion_matrixto weight the samples.- percent: bool, default: False
Determines whether or not the confusion_matrix is displayed as counts or as a percent of true predictions. Note, if specifying a subset of classes, percent should be set to False or inaccurate figures will be displayed.
- classeslist of str, defult: None
The class labels to use for the legend ordered by the index of the sorted classes discovered in the
fit()method. Specifying classes in this manner is used to change the class names to a more specific format or to label encoded integer classes. Some visualizers may also use this field to filter the visualization for specific classes. For more advanced usage specify an encoder rather than class labels.- encoderdict or LabelEncoder, default: None
A mapping of classes to human readable labels. Often there is a mismatch between desired class labels and those contained in the target variable passed to
fit()orscore(). The encoder disambiguates this mismatch ensuring that classes are labeled correctly in the visualization.- cmapstring, default:
'YlOrRd' Specify a colormap to define the heatmap of the predicted class against the actual class in the confusion matrix.
- fontsizeint, default: None
Specify the fontsize of the text in the grid and labels to make the matrix a bit easier to read. Uses rcParams font size by default.
- is_fittedbool or str, default=”auto”
Specify if the wrapped estimator is already fitted. If False, the estimator will be fit when the visualizer is fit, otherwise, the estimator will not be modified. If “auto” (default), a helper method will check if the estimator is fitted before fitting it again.
- force_modelbool, default: False
Do not check to ensure that the underlying estimator is a classifier. This will prevent an exception when the visualizer is initialized but may result in unexpected or unintended behavior.
- kwargsdict
Keyword arguments passed to the visualizer base classes.
Examples
>>> from yellowbrick.classifier import ConfusionMatrix
>>> from sklearn.linear_model import LogisticRegression
>>> viz = ConfusionMatrix(LogisticRegression())
>>> viz.fit(X_train, y_train)
>>> viz.score(X_test, y_test)
>>> viz.show()
- Attributes
- classes_ndarray of shape (n_classes,)
The class labels observed while fitting.
- class_counts_ndarray of shape (n_classes,)
Number of samples encountered for each class supporting the confusion matrix.
- score_float
An evaluation metric of the classifier on test data produced when
score()is called. This metric is between 0 and 1 – higher scores are generally better. For classifiers, this score is usually accuracy, but ensure you check the underlying model for more details about the metric.- confusion_matrix_array, shape = [n_classes, n_classes]
The numeric scores of the confusion matrix.
- finalize(**kwargs)[source]
Finalize executes any subclass-specific axes finalization steps.
- Parameters
- kwargs: dict
generic keyword arguments.
Notes
The user calls show and show calls finalize. Developers should implement visualizer-specific finalization methods like setting titles or axes labels, etc.
- score(X, y)[source]
Draws a confusion matrix based on the test data supplied by comparing predictions on instances X with the true values specified by the target vector y.
- Parameters
- Xndarray or DataFrame of shape n x m
A matrix of n instances with m features
- yndarray or Series of length n
An array or series of target or class values
- Returns
- score_float
Global accuracy score
- show(outpath=None, **kwargs)[source]
Makes the magic happen and a visualizer appear! You can pass in a path to save the figure to disk with various backends, or you can call it with no arguments to show the figure either in a notebook or in a GUI window that pops up on screen.
- Parameters
- outpath: string, default: None
path or None. Save figure to disk or if None show in window
- clear_figure: boolean, default: False
When True, this flag clears the figure after saving to file or showing on screen. This is useful when making consecutive plots.
- kwargs: dict
generic keyword arguments.
Notes
Developers of visualizers don’t usually override show, as it is primarily called by the user to render the visualization.
- yellowbrick.classifier.confusion_matrix.confusion_matrix(estimator, X_train, y_train, X_test=None, y_test=None, ax=None, sample_weight=None, percent=False, classes=None, encoder=None, cmap='YlOrRd', fontsize=None, is_fitted='auto', force_model=False, show=True, **kwargs)[source]
Confusion Matrix
Creates a heatmap visualization of the sklearn.metrics.confusion_matrix(). A confusion matrix shows each combination of the true and predicted classes for a test data set.
The default color map uses a yellow/orange/red color scale. The user can choose between displaying values as the percent of true (cell value divided by sum of row) or as direct counts. If percent of true mode is selected, 100% accurate predictions are highlighted in green.
Requires a classification model.
- Parameters
- estimatorestimator
A scikit-learn estimator that should be a classifier. If the model is not a classifier, an exception is raised. If the internal model is not fitted, it is fit when the visualizer is fitted, unless otherwise specified by
is_fitted.- X_trainarray-like, 2D
The table of instance data or independent variables that describe the outcome of the dependent variable, y. Used to fit the visualizer and also to score the visualizer if test splits are not specified.
- y_trainarray-like, 2D
The vector of target data or the dependent variable predicted by X. Used to fit the visualizer and also to score the visualizer if test splits are not specified.
- X_test: array-like, 2D, default: None
The table of instance data or independent variables that describe the outcome of the dependent variable, y. Used to score the visualizer if specified.
- y_test: array-like, 1D, default: None
The vector of target data or the dependent variable predicted by X. Used to score the visualizer if specified.
- axmatplotlib Axes, default: None
The axes to plot the figure on. If not specified the current axes will be used (or generated if required).
- sample_weight: array-like of shape = [n_samples], optional
Passed to
confusion_matrixto weight the samples.- percent: bool, default: False
Determines whether or not the confusion_matrix is displayed as counts or as a percent of true predictions. Note, if specifying a subset of classes, percent should be set to False or inaccurate figures will be displayed.
- classeslist of str, defult: None
The class labels to use for the legend ordered by the index of the sorted classes discovered in the
fit()method. Specifying classes in this manner is used to change the class names to a more specific format or to label encoded integer classes. Some visualizers may also use this field to filter the visualization for specific classes. For more advanced usage specify an encoder rather than class labels.- encoderdict or LabelEncoder, default: None
A mapping of classes to human readable labels. Often there is a mismatch between desired class labels and those contained in the target variable passed to
fit()orscore(). The encoder disambiguates this mismatch ensuring that classes are labeled correctly in the visualization.- cmapstring, default:
'YlOrRd' Specify a colormap to define the heatmap of the predicted class against the actual class in the confusion matrix.
- fontsizeint, default: None
Specify the fontsize of the text in the grid and labels to make the matrix a bit easier to read. Uses rcParams font size by default.
- is_fittedbool or str, default=”auto”
Specify if the wrapped estimator is already fitted. If False, the estimator will be fit when the visualizer is fit, otherwise, the estimator will not be modified. If “auto” (default), a helper method will check if the estimator is fitted before fitting it again.
- force_modelbool, default: False
Do not check to ensure that the underlying estimator is a classifier. This will prevent an exception when the visualizer is initialized but may result in unexpected or unintended behavior.
- show: bool, default: True
If True, calls
show(), which in turn callsplt.show()however you cannot callplt.savefigfrom this signature, norclear_figure. If False, simply callsfinalize()- kwargsdict
Keyword arguments passed to the visualizer base classes.
- Returns
- vizConfusionMatrix
Returns the fitted, finalized visualizer