Rank Features
Rank1D and Rank2D evaluate single features or pairs of features using a variety of metrics that score the features on the scale [-1, 1] or [0, 1] allowing them to be ranked. A similar concept to SPLOMs, the scores are visualized on a lower-left triangle heatmap so that patterns between pairs of features can be easily discerned for downstream analysis.
In this example, we’ll use the credit default data set from the UCI Machine Learning repository to rank features. The code below creates our instance matrix and target vector.
Visualizers |
|
Quick Methods |
|
Models |
General Linear Models |
Workflow |
Feature engineering and model selection |
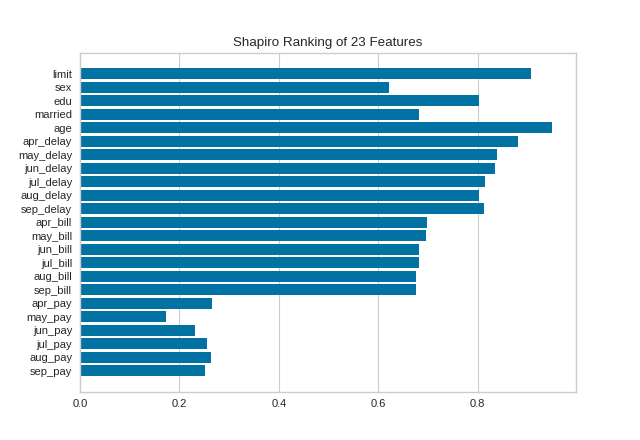
Rank 1D
A one-dimensional ranking of features utilizes a ranking algorithm that takes into account only a single feature at a time (e.g. histogram analysis). By default we utilize the Shapiro-Wilk algorithm to assess the normality of the distribution of instances with respect to the feature. A barplot is then drawn showing the relative ranks of each feature.
from yellowbrick.datasets import load_credit
from yellowbrick.features import Rank1D

# Load the credit dataset
X, y = load_credit()

# Instantiate the 1D visualizer with the Shapiro ranking algorithm
visualizer = Rank1D(algorithm='shapiro')

visualizer.fit(X, y)           # Fit the data to the visualizer
visualizer.transform(X)        # Transform the data
visualizer.show()              # Finalize and render the figure
(Source code, png, pdf)
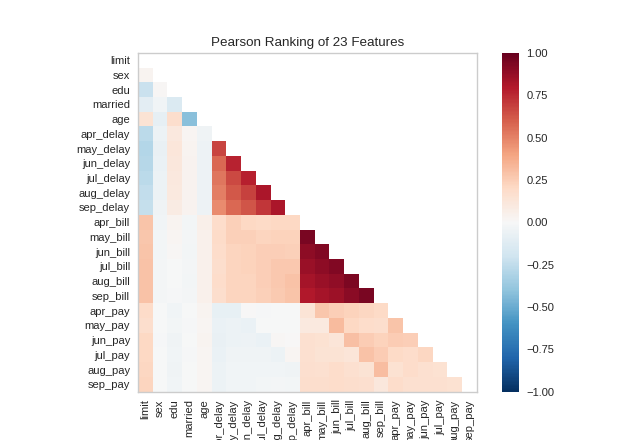
Rank 2D
A two-dimensional ranking of features utilizes a ranking algorithm that takes into account pairs of features at a time (e.g. joint plot analysis). The pairs of features are then ranked by score and visualized using the lower left triangle of a feature co-occurence matrix.
By default, the Rank2D visualizer utilizes the Pearson correlation score to detect colinear relationships.
from yellowbrick.datasets import load_credit
from yellowbrick.features import Rank2D

# Load the credit dataset
X, y = load_credit()

# Instantiate the visualizer with the Pearson ranking algorithm
visualizer = Rank2D(algorithm='pearson')

visualizer.fit(X, y)           # Fit the data to the visualizer
visualizer.transform(X)        # Transform the data
visualizer.show()              # Finalize and render the figure
(Source code, png, pdf)
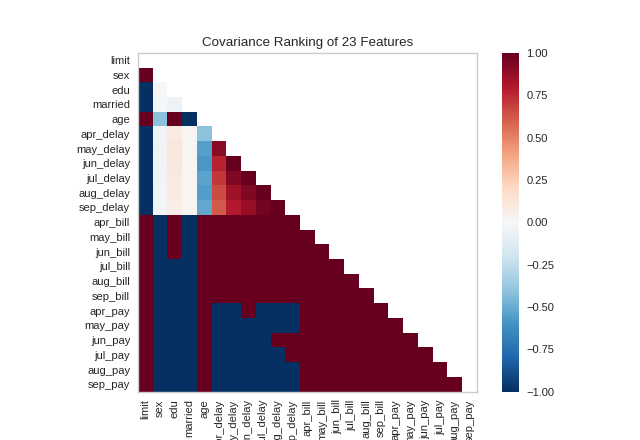
Alternatively, we can utilize the covariance ranking algorithm, which attempts to compute the mean value of the product of deviations of variates from their respective means. Covariance loosely attempts to detect a colinear relationship between features. Compare the output from Pearson above to the covariance ranking below.
from yellowbrick.datasets import load_credit
from yellowbrick.features import Rank2D

# Load the credit dataset
X, y = load_credit()

# Instantiate the visualizer with the covariance ranking algorithm
visualizer = Rank2D(algorithm='covariance')

visualizer.fit(X, y)           # Fit the data to the visualizer
visualizer.transform(X)        # Transform the data
visualizer.show()              # Finalize and render the figure
(Source code, png, pdf)

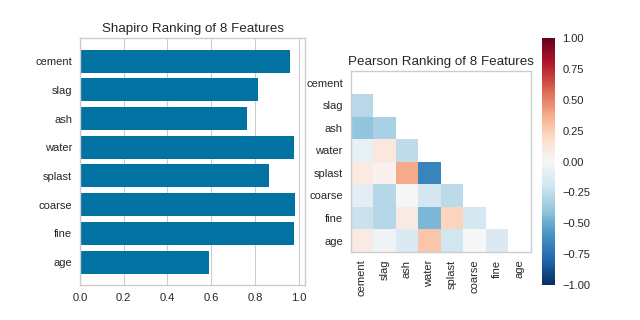
Quick Methods
Similar functionality can be achieved using the one line quick methods, rank1d and rank2d. These functions instantiate and fit their respective visualizer on the data and immediately show it without having to use the class-based API.
from yellowbrick.datasets import load_concrete
from yellowbrick.features import rank1d, rank2d

# Load the concrete dataset
X, _ = load_concrete()

_, axes = plt.subplots(ncols=2, figsize=(8,4))

rank1d(X, ax=axes[0], show=False)
rank2d(X, ax=axes[1], show=False)
plt.show()
(Source code, png, pdf)

API Reference
Implements 1D (histograms) and 2D (joint plot) feature rankings.
- class yellowbrick.features.rankd.Rank1D(ax=None, algorithm='shapiro', features=None, orient='h', show_feature_names=True, color=None, **kwargs)[source]
Bases:
RankDBaseRank1D computes a score for each feature in the data set with a specific metric or algorithm (e.g. Shapiro-Wilk) then returns the features ranked as a bar plot.
- Parameters
- axmatplotlib Axes, default: None
The axis to plot the figure on. If None is passed in the current axes will be used (or generated if required).
- algorithmone of {‘shapiro’, }, default: ‘shapiro’
The ranking algorithm to use, default is ‘Shapiro-Wilk.
- featureslist
A list of feature names to use. If a DataFrame is passed to fit and features is None, feature names are selected as the columns of the DataFrame.
- orient‘h’ or ‘v’, default=’h’
Specifies a horizontal or vertical bar chart.
- show_feature_namesboolean, default: True
If True, the feature names are used to label the x and y ticks in the plot.
- color: string
Specify color for barchart
- kwargsdict
Keyword arguments that are passed to the base class and may influence the visualization as defined in other Visualizers.
Examples
>>> visualizer = Rank1D()
>>> visualizer.fit(X, y)
>>> visualizer.transform(X)
>>> visualizer.show()
- Attributes
- ranks_ndarray
An array of rank scores with shape (n,), where n is the number of features. It is computed during fit.
- ranking_methods = {'shapiro': <function Rank1D.<lambda>>}
- class yellowbrick.features.rankd.Rank2D(ax=None, algorithm='pearson', features=None, colormap='RdBu_r', show_feature_names=True, **kwargs)[source]
Bases:
RankDBaseRank2D performs pairwise comparisons of each feature in the data set with a specific metric or algorithm (e.g. Pearson correlation) then returns them ranked as a lower left triangle diagram.
- Parameters
- axmatplotlib Axes, default: None
The axis to plot the figure on. If None is passed in the current axes will be used (or generated if required).
- algorithmstr, default: ‘pearson’
The ranking algorithm to use, one of: ‘pearson’, ‘covariance’, ‘spearman’, or ‘kendalltau’.
- featureslist
A list of feature names to use. If a DataFrame is passed to fit and features is None, feature names are selected as the columns of the DataFrame.
- colormapstring or cmap, default: ‘RdBu_r’
optional string or matplotlib cmap to colorize lines Use either color to colorize the lines on a per class basis or colormap to color them on a continuous scale.
- show_feature_namesboolean, default: True
If True, the feature names are used to label the axis ticks in the plot.
- kwargsdict
Keyword arguments that are passed to the base class and may influence the visualization as defined in other Visualizers.
Notes
These parameters can be influenced later on in the visualization process, but can and should be set as early as possible.
Examples
>>> visualizer = Rank2D()
>>> visualizer.fit(X, y)
>>> visualizer.transform(X)
>>> visualizer.show()
- Attributes
- ranks_ndarray
An array of rank scores with shape (n,n), where n is the number of features. It is computed during fit.
- ranking_methods = {'covariance': <function Rank2D.<lambda>>, 'kendalltau': <function Rank2D.<lambda>>, 'pearson': <function Rank2D.<lambda>>, 'spearman': <function Rank2D.<lambda>>}
- yellowbrick.features.rankd.rank1d(X, y=None, ax=None, algorithm='shapiro', features=None, orient='h', show_feature_names=True, color=None, show=True, **kwargs)[source]
Scores each feature with the algorithm and ranks them in a bar plot.
This helper function is a quick wrapper to utilize the Rank1D Visualizer (Transformer) for one-off analysis.
- Parameters
- Xndarray or DataFrame of shape n x m
A matrix of n instances with m features
- yndarray or Series of length n
An array or series of target or class values
- axmatplotlib axes
the axis to plot the figure on.
- algorithmone of {‘shapiro’, }, default: ‘shapiro’
The ranking algorithm to use, default is ‘Shapiro-Wilk.
- featureslist
A list of feature names to use. If a DataFrame is passed to fit and features is None, feature names are selected as the columns of the DataFrame.
- orient‘h’ or ‘v’
Specifies a horizontal or vertical bar chart.
- show_feature_namesboolean, default: True
If True, the feature names are used to label the axis ticks in the plot.
- color: string
Specify color for barchart
- show: bool, default: True
If True, calls
show(), which in turn callsplt.show()however you cannot callplt.savefigfrom this signature, norclear_figure. If False, simply callsfinalize()- kwargsdict
Keyword arguments that are passed to the base class and may influence the visualization as defined in other Visualizers.
- Returns
- vizRank1D
Returns the fitted, finalized visualizer.
- yellowbrick.features.rankd.rank2d(X, y=None, ax=None, algorithm='pearson', features=None, colormap='RdBu_r', show_feature_names=True, show=True, **kwargs)[source]
Rank2D quick method
Rank2D performs pairwise comparisons of each feature in the data set with a specific metric or algorithm (e.g. Pearson correlation) then returns them ranked as a lower left triangle diagram.
- Parameters
- Xndarray or DataFrame of shape n x m
A matrix of n instances with m features to perform the pairwise compairsons on.
- yndarray or Series of length n, default: None
An array or series of target or class values, optional (not used).
- axmatplotlib Axes, default: None
The axis to plot the figure on. If None is passed in the current axes will be used (or generated if required).
- algorithmstr, default: ‘pearson’
The ranking algorithm to use, one of: ‘pearson’, ‘covariance’, ‘spearman’, or ‘kendalltau’.
- featureslist
A list of feature names to use. If a DataFrame is passed to fit and features is None, feature names are selected as the columns of the DataFrame.
- colormapstring or cmap, default: ‘RdBu_r’
optional string or matplotlib cmap to colorize lines Use either color to colorize the lines on a per class basis or colormap to color them on a continuous scale.
- show_feature_namesboolean, default: True
If True, the feature names are used to label the axis ticks in the plot.
- show: bool, default: True
If True, calls
show(), which in turn callsplt.show()however you cannot callplt.savefigfrom this signature, norclear_figure. If False, simply callsfinalize()- kwargsdict
Keyword arguments that are passed to the base class and may influence the visualization as defined in other Visualizers.
- Returns
- vizRank2D
Returns the fitted, finalized visualizer that created the Rank2D heatmap.